
To build an OEE baseline, pick one constraint machine or line, fix the definitions of planned time, ideal cycle time and a good part, then log downtime, output and rejects every shift, by hand if you have to.
Calculate OEE as availability × performance × quality and keep the loss breakdown, because that is what tells you whether MES software will fix anything. Many Indian plants can start with the machines, PLC counters and shift registers they already have.
Who this is for:
Plant heads, process excellence heads and strategy or transformation heads deciding whether and when to buy an MES, and the engineers who will collect the data.

What you'll be able to do after reading:
Set up a defensible OEE baseline on one line, read its loss breakdown, and turn it into an MES requirement that vendors must prove against.
What is an OEE baseline, and why do you need one before an MES purchase?
OEE is a measure; an MES is software. NIST IR 7911 describes MES activities as dispatching and executing production orders, collecting production data and analysing production performance. OEE is one of the numbers that analysis produces. In the ISA-95 model, MES sits at Level 3, manufacturing operations management. An OEE baseline is that number, with its three factors and its losses, measured the same way over a fixed period before anything changes. For a general definition, Wikipedia’s article on overall equipment effectiveness is useful further reading.
Without a baseline, an MES project has no yardstick. With one, you can ask a vendor which of your losses their system recovers and check the answer later against your own locked figure.
We don’t trust our current OEE numbers. Where do we start?
Start with definitions, not software. Most distrusted OEE numbers are calculated correctly from inputs that mean different things on different shifts:
- Planned time is not fixed. One shift deducts tea breaks and the weekly PM, another does not.
- The ideal cycle time is today’s average. That hides every slow cycle and makes performance look close to 100%.
- Short stops are never written down. A two-minute jam that happens thirty times a shift is invisible in a log that only records breakdowns.
- Rework is counted as good. The ISO 22400-2 quality rate counts only parts that were right the first time.
- Machines are averaged. A simple average of five machines’ OEE says nothing about the line’s output.
What is the difference between OEE and MES?
OEE is a performance measure. An MES is software that runs and records production, and it can calculate OEE among many other things.
How do you calculate OEE for a machine?
NIST AMS 300-11 defines OEE as the product of availability, performance and quality. ISO 22400-2, the international standard for manufacturing KPIs, uses the same structure; the full ISO text is a paid document. A free paper by Kang and colleagues, hosted by NIST, explains the ISO 22400 time and quantity elements behind these formulas. We use the ISO 22400-2 quality rate, which counts only good parts and excludes rework. The NIST paper itself uses a “quality buy rate” that counts reworked parts as good, so check which definition a vendor uses.
| Factor | Formula | Loss it shows |
|---|---|---|
| Availability | Actual run time ÷ planned busy time | Breakdowns, changeovers, waiting for material or operators |
| Performance | (Ideal cycle time × total count) ÷ actual run time | Slow cycles and short stops |
| Quality | Good count ÷ total count | Scrap and rework |
A shortcut gives the same answer: good count × ideal cycle time ÷ planned busy time. If your two methods disagree, an input is wrong.
Worked example: one shift by hand
These numbers are illustrative, not a benchmark.
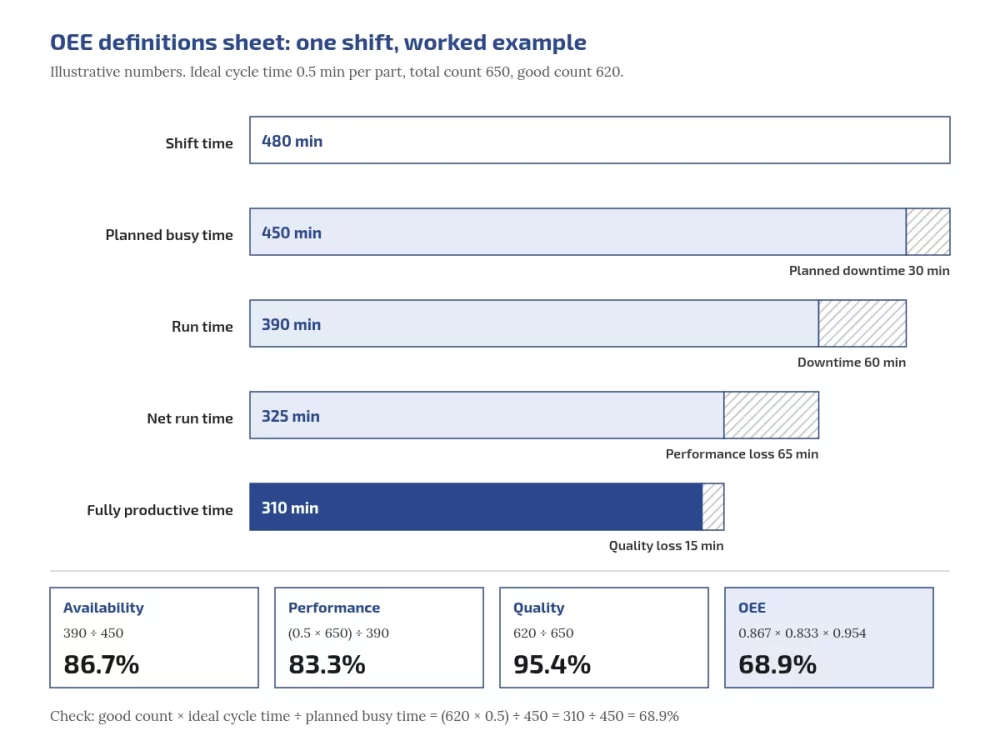
- Shift length 480 minutes, with a 30 minute planned break. Planned busy time = 450 minutes.
- Logged unplanned downtime 60 minutes. Actual run time = 450 − 60 = 390 minutes.
- Ideal cycle time 30 seconds (0.5 minute) per part. Total count 650 parts. Good count 620 parts.
- Availability = 390 ÷ 450 = 86.7%.
- Performance = (0.5 × 650) ÷ 390 = 325 ÷ 390 = 83.3%.
- Quality = 620 ÷ 650 = 95.4%.
- OEE = 0.867 × 0.833 × 0.954 = 68.9%. Check: (620 × 0.5) ÷ 450 = 310 ÷ 450 = 68.9%.
| Bucket | Minutes | How it is worked out |
|---|---|---|
| Availability loss | 60 | Unplanned downtime |
| Performance loss | 65 | 390 run minutes − 325 minutes of ideal production |
| Quality loss | 15 | 30 bad parts × 0.5 minute |
| Fully productive time | 310 | 620 good parts × 0.5 minute |
| Total | 450 | Equals planned busy time |
Here the biggest loss is speed, not breakdowns. A downtime-reason screen alone would not recover those 65 minutes, which is exactly the kind of finding that should shape an MES requirement.
Which definitions do you lock first: planned downtime, ideal cycle time and good parts?
- Planned downtime. In the ISO 22400 elements explained in the NIST paper, planned operation time = planned busy time + planned downtime, and planned downtime includes scheduled breaks, meetings and maintenance. So planned downtime comes out before availability is calculated. Decide what counts as planned and write it down.
- Ideal cycle time. Use the validated or nameplate cycle time per product, not the usual average. If performance comes out above 100%, the ideal cycle time has been set too long (too slow), or a count is wrong.
- Good part. Right first time only. Count rework separately.
- Downtime reasons. A short list, ideally under ten, plus “other”.
Get production, maintenance and quality to sign this one-page sheet before collecting data.
Does OEE include planned downtime?
In the ISO 22400 elements explained by NIST, planned downtime is removed before availability is calculated. Some plants include it; either works if written down and kept fixed.
Can OEE be more than 100%?
Not with correct inputs. Above 100% usually means the ideal cycle time is set too long, or a count is wrong.
Who should own the baseline?
Production or process engineering, with maintenance and quality signing the definitions. IT supports the data.
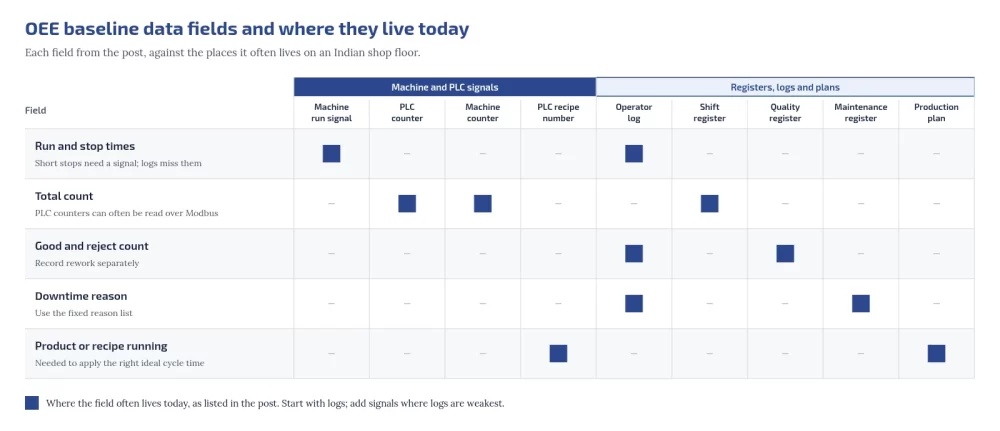
Which data fields do you collect, and where do they live on an Indian shop floor?
| Field | Where it often lives today | Notes |
|---|---|---|
| Run and stop times | Machine run signal, operator log | Short stops need a signal; logs miss them |
| Total count | PLC counter, machine counter, shift register | PLC counters can often be read over Modbus |
| Good and reject count | Quality register, operator log | Record rework separately |
| Downtime reason | Operator log, maintenance register | Use the fixed reason list |
| Product or recipe running | Production plan, PLC recipe number | Needed to apply the right ideal cycle time |
If a PLC counter is reachable, you can decode PLC counter registers with a free tool. Where a sensor signal stands in for a run state, for example a motor current transmitter, you may need to scale 4-20 mA signals correctly.
Can we baseline with manual logs, or do we need sensors first?
| Method | Effort to start | Captures well | Misses |
|---|---|---|---|
| Manual shift log | Low | Long stops, reasons, scrap | Short stops, exact times |
| Manual log plus run/stop and count signals | Moderate | Exact run time, counts, short stops | Reasons, unless operators tag them |
| Full MES | High | All of the above plus orders and quality steps | Nothing in scope, if adopted |
Start with logs; add signals where logs are weakest. Older machines may need a retrofit to give a run signal.
Which machines do we baseline first?
- The constraint, the machine that sets the line’s output.
- The machine your MES business case leans on most.
- A machine where the shift team is willing to log honestly.
- A machine where a run/stop signal is easy to reach.
Which data fields are essential to collect for OEE?
Planned busy time, unplanned downtime, ideal cycle time, total count and good count, plus the product running and downtime reasons.
Do we need to stop production to set up a baseline?
No. Manual logging needs no downtime. Adding a run/stop signal may need a short electrical job, which can go into an existing planned stop.
How long should you measure, and what do you exclude?
No standard fixes a baseline length, so a fixed number of days, 30 or any other, is a choice rather than a rule. A baseline means something once it covers your plant’s normal variation:
- every shift and crew, including night shift;
- at least one full cycle of your product mix and changeover types;
- your usual maintenance pattern;
- a weekly figure that has stopped moving much from week to week.
Exclude only what your definitions sheet excludes, such as declared planned downtime, and note one-off events (a power cut, a trial run) separately rather than deleting them. Historical data can serve as a baseline only if it was recorded with the same definitions; otherwise treat it as indicative and start a fresh log.
Can I use historical data as a baseline?
Only if it was recorded with the same definitions you will use later. Otherwise use it as a rough guide and start a clean log.

What is a good OEE number, and why not compare with “world class” figures?
ISO 22400 defines how to calculate OEE, not what it should be. Published “world class” figures come from different sources, industries and definitions, and none is set by a standard. Your baseline is only comparable with itself, measured the same way later.
What is a good OEE score in manufacturing?
There is no standard target. ISO 22400 defines the calculation, not a goal. Compare a machine against its own baseline.
How do you turn the baseline into an MES requirement and vendor scorecard?
Lock the baseline and give every vendor the same one-page summary: OEE, the three factors and minutes lost per bucket. Then score proposals like this:
| Ask the vendor | What good evidence looks like |
|---|---|
| Which of our loss buckets does your system address, and how? | A specific mechanism per bucket, not a general percentage |
| Will you calculate OEE with our signed definitions? | Yes, including the ISO 22400-2 quality rate without rework |
| How will you prove the improvement? | Measured against our locked baseline, same definitions, same machines |
| What data do you need from our machines and ERP? | A signal list and an integration plan, see MES vs ERP |
How does a baseline compare in effort with a full MES?
A baseline needs a definitions sheet, a log, a spreadsheet and, at most, a few signals. An MES needs product and routing master data, an ERP integration, operator workflows, training and change management. The baseline fits inside one department, and it tells you whether the bigger project is aimed at your real losses. Planning a new plant instead? Put the same definitions into your greenfield plant digital readiness checklist.
Is the baseline wasted if we buy an MES later?
No. The definitions, downtime reasons and baseline figures become the MES configuration and the yardstick for judging it.
Where does Embedos fit?
For the baseline period, the hard part is often getting run and count signals off older machines. The Embedos Edge page describes the device as capturing machine and sensor data and sending it to cloud storage or a factory control room. Our pages on plant KPI dashboards for leadership and shift-level visibility for plant managers describe how we approach this.
Next step
Want a clean OEE baseline on one line before you commit to an MES? We run a fixed-scope POC in one department. Email team@embedos.io to discuss an OEE baseline POC.