FMCG Performance Monitoring Case Study
IoT-Based Washing Machine Testing
Summary
A leading FMCG Company in Mumbai, implemented an advanced IoT-based washing machine performance monitoring system to collect comprehensive data on washing machine operations across multiple testing parameters.
The solution utilized Embedos hardware (Em Edison and Em Maxwell devices) to capture critical performance metrics including water consumption, temperature, motor rotation, power consumption, and cycle duration.
This case study examines the technical implementation, application logic, and benefits of this advanced testing infrastructure.
Challenge
The company needed to conduct detailed performance analysis of washing machines with the following requirements:
- Accurate measurement of multiple performance metrics simultaneously.
- Real-time data acquisition during machine operation.
- Comprehensive reporting for performance analysis.
- Robust data logging for quality control purposes.
- Flexible system capable of testing different washing machine models.
The company required reliable data on wash cycle parameters to optimize product formulations, evaluate machine efficiency, and ensure consistent performance across various testing scenarios.
Solution
Hardware Architecture
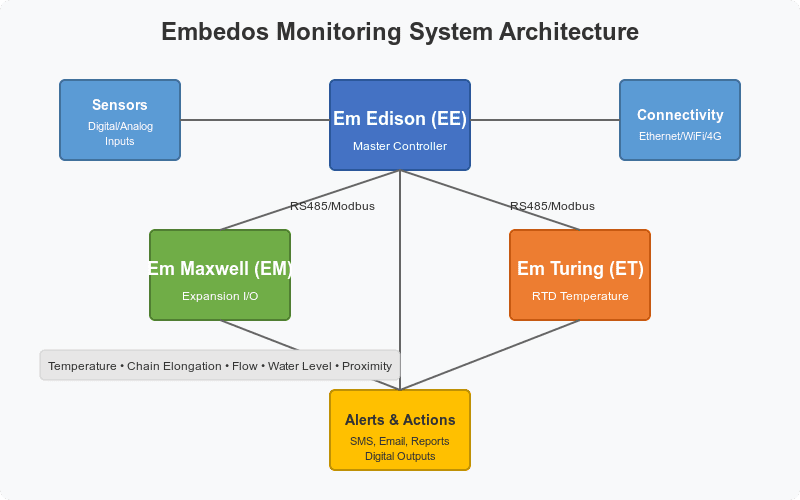
The solution was built using a combination of Embedos hardware components:
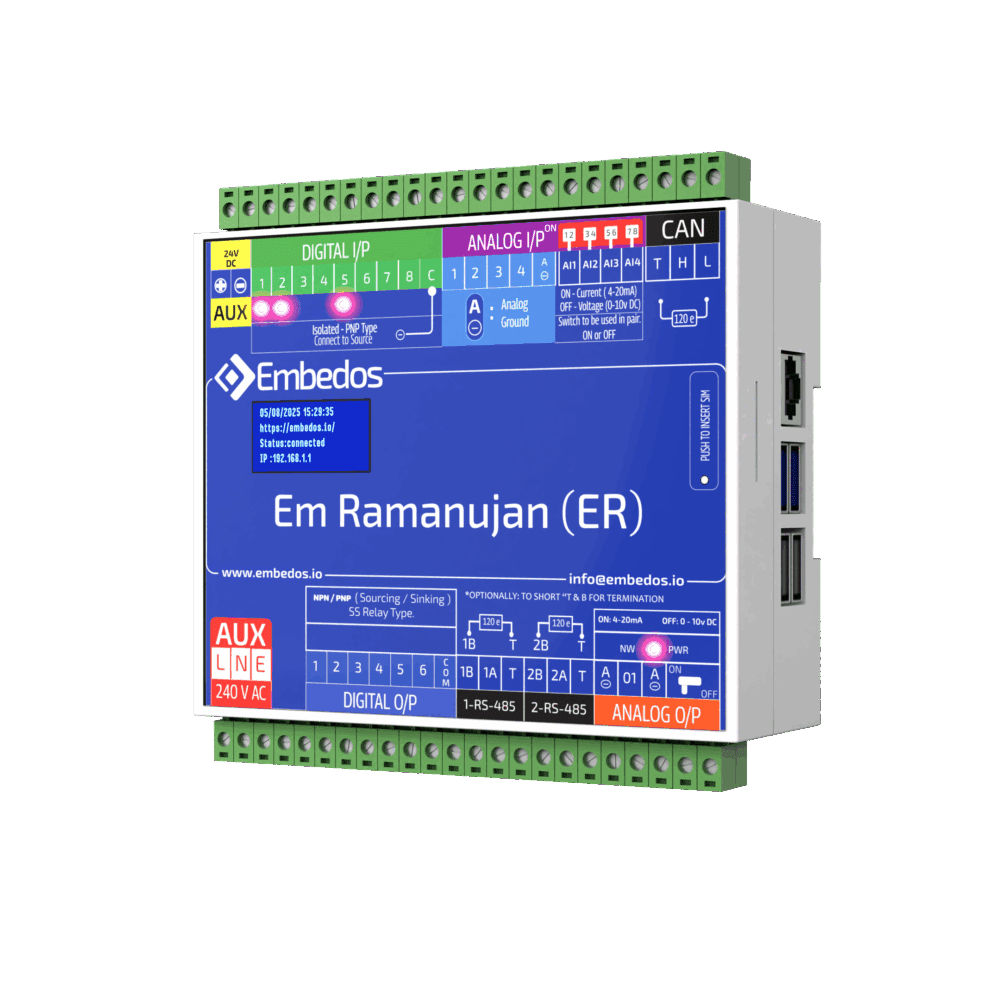
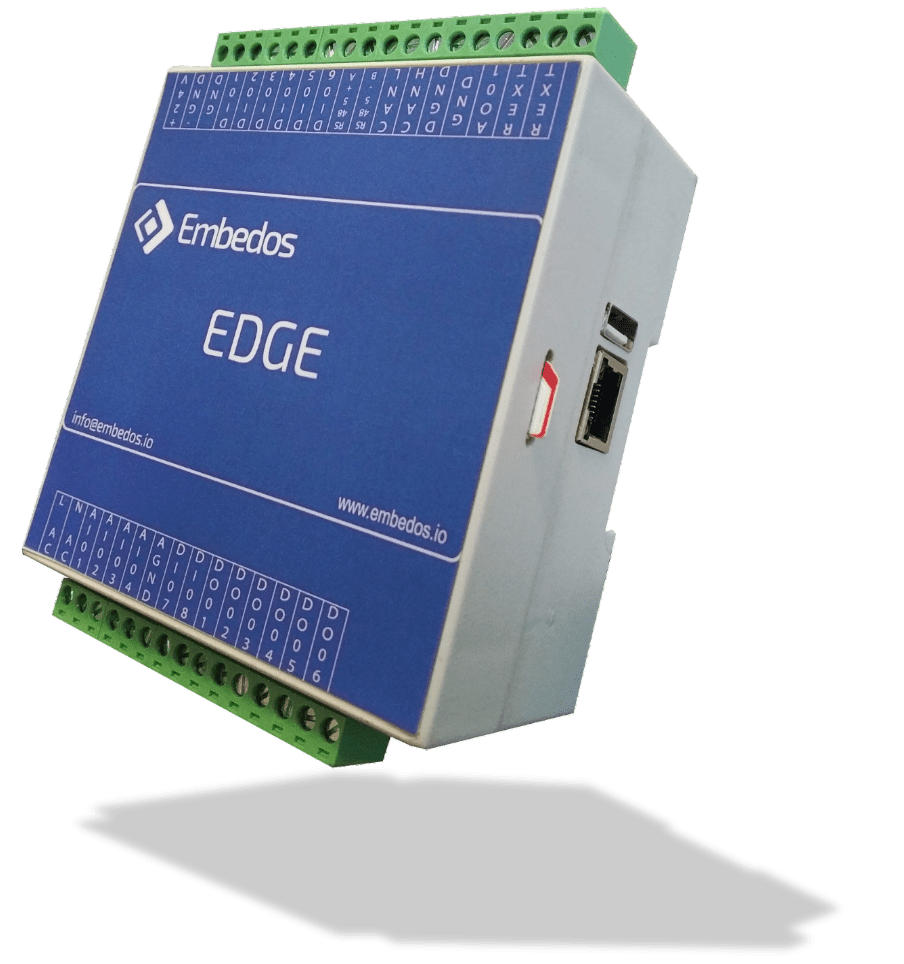
- Embedos Edge Automation Controller (EE/Edison) – Primary control unit responsible for:
- Acting as the Modbus master.
- Interfacing with the energy meter.
- Generating reports and storing data.
- Providing web interface access for operators.
- Network connectivity via Ethernet/Wi-Fi.
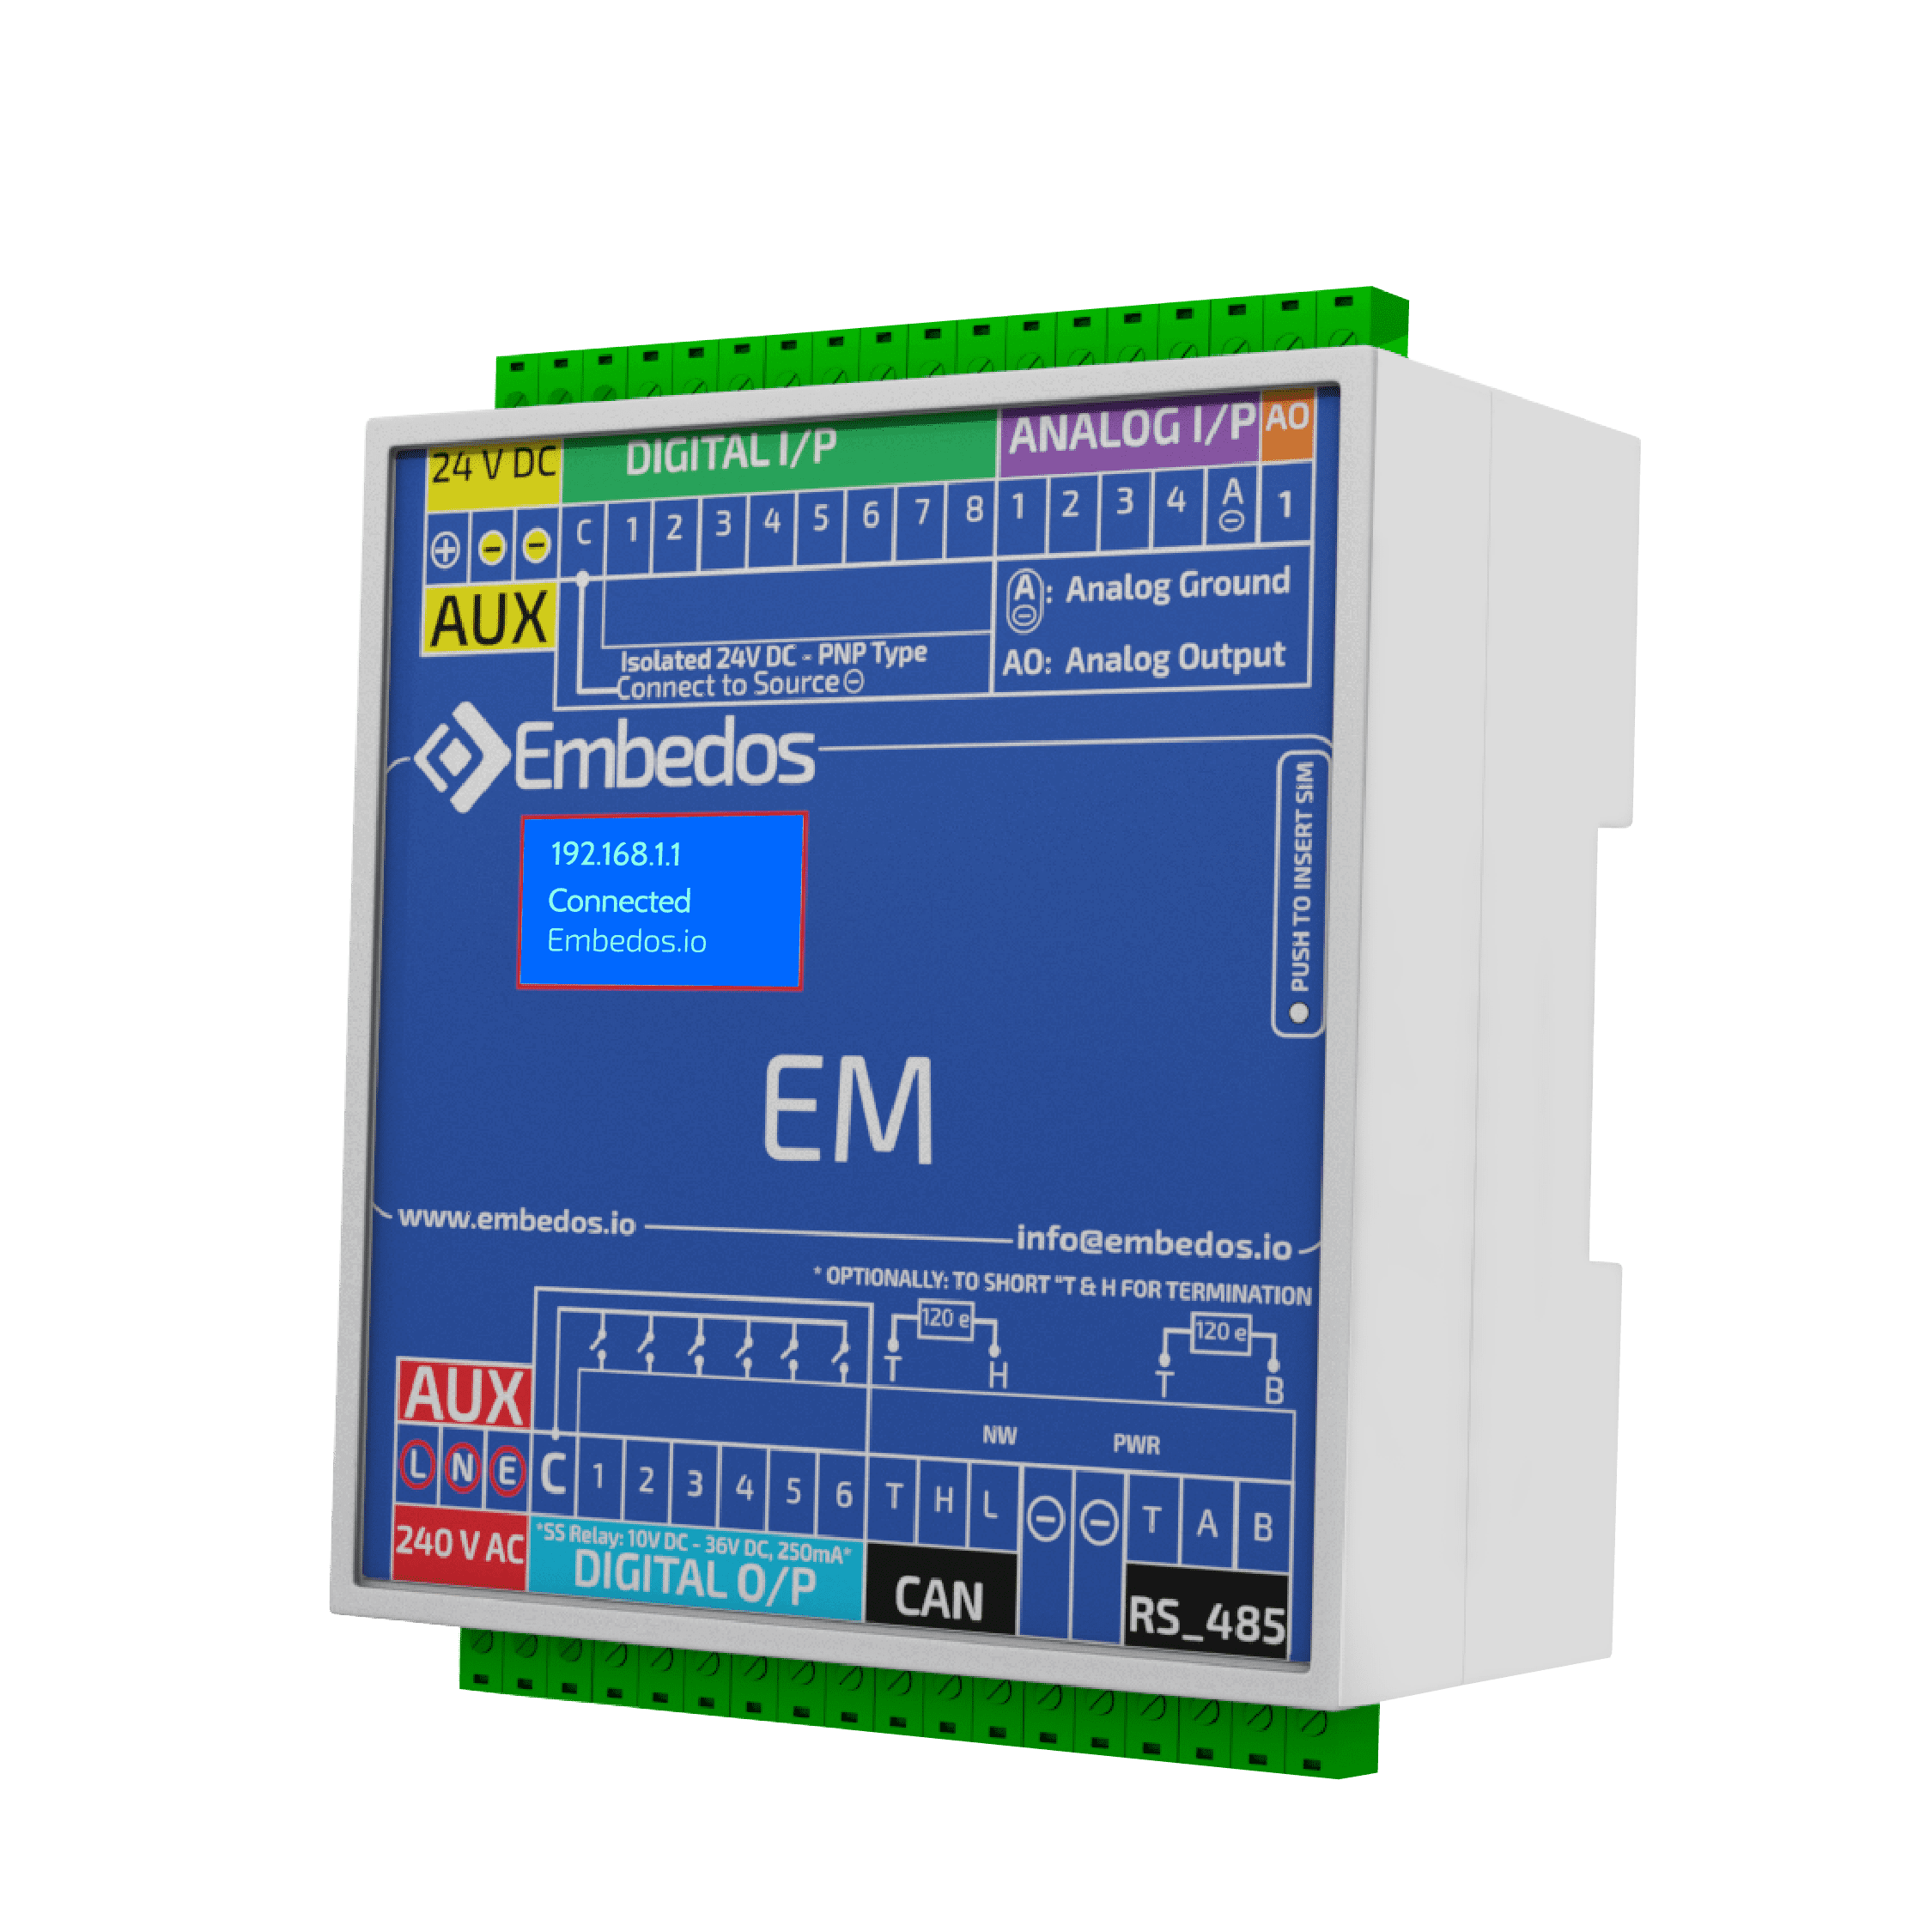
- Embedos Advanced Edge Expansion IO Card (EM/Maxwell) – Data acquisition unit responsible for:
- Sensor data collection (analog and digital inputs).
- Real-time monitoring of machine parameters.
- Processing sensor data.
- Communicating with EE device via Modbus.
- Third-party Energy Meter – For electrical parameter monitoring.
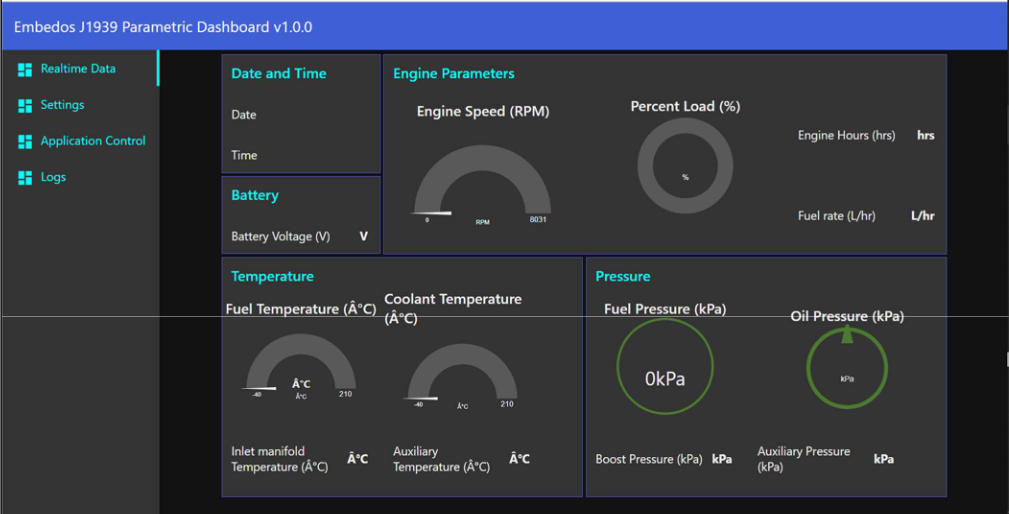
Monitored Parameters
The system captures comprehensive machine performance data:
| Parameter Category | Specific Metrics |
|---|---|
| Cycle Timing |
Start-stop time, Duration of each cycle |
| Water |
Temperature, Inlet flow rate, Total water consumption |
| Motor | RPM, Number of clockwise/ anticlockwise rotations (agitation and spin) |
| Electrical | Voltage, Current, Power factor, Power (KW), Energy consumed |
Technical Implementation
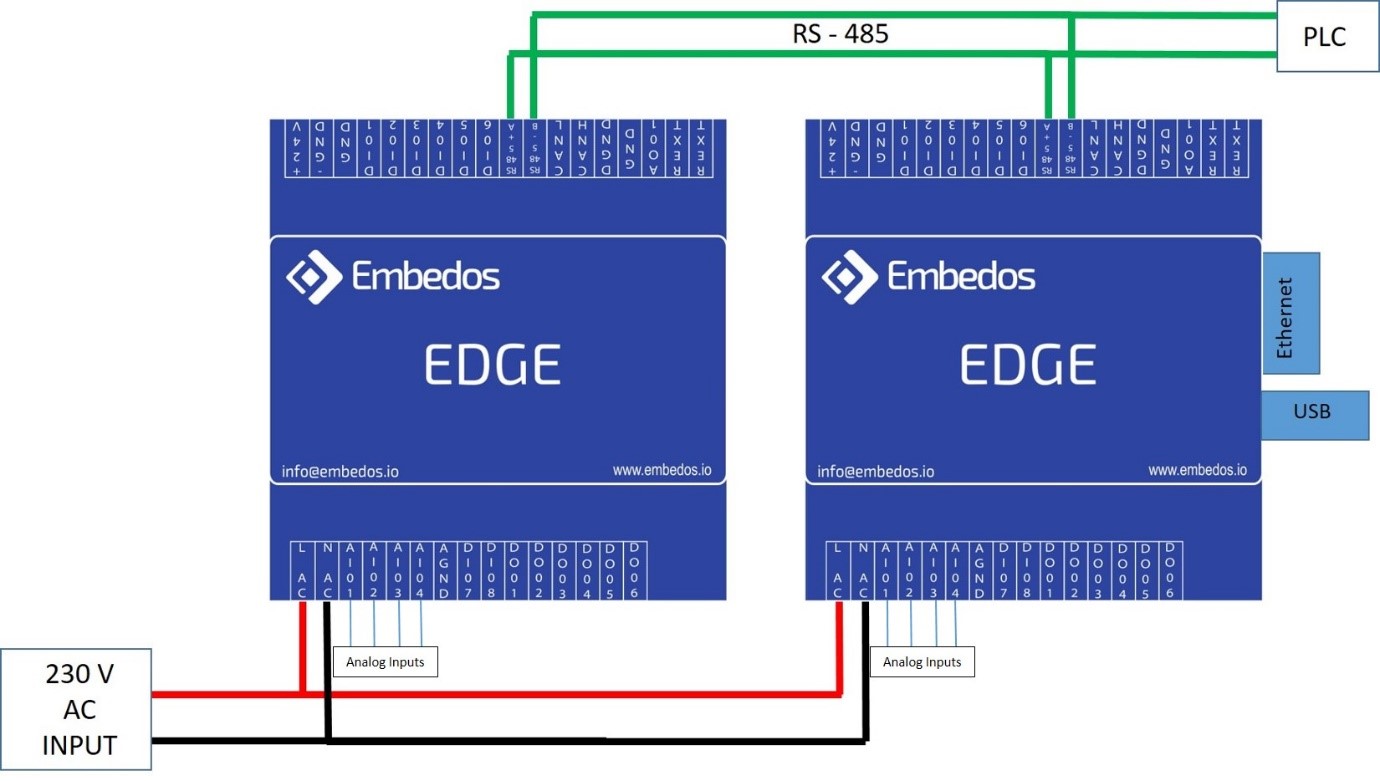
Communication Architecture
- All devices interfaced using Modbus protocol.
- EE (Edison) serves as Modbus master.
- EM (Maxwell) and Energy Meter operate as Modbus slaves.
- RS485 port connections between devices.
Sensor Deployment
- Water temperature sensor connected to EM analog input.
- Flow rate sensor connected to EM analog input.
- Rotation sensors positioned at 90-degree intervals for direction detection.
- Digital inputs for cycle detection and motor monitoring.
Application Logic Flow
- Initial Setup and Configuration:
- Operator enters project details (machine number, make, gear ratios, etc.).
- System calibration for specific analog sensors.
- Data Acquisition Process:
- EM continuously monitors sensor data.
- Water flow calculation:
INLET_WATER_TOTALIZED + (INLET_FLOW_RATE / (flow_to_volume_factor/loop_interval)). - Motor RPM calculation based on time between sensor triggers.
- Direction determination using 90-degree sensor placement.
- Energy meter readings captured at regular intervals.
- Report Generation:
- EE logs all parameters from EM and energy meter.
- Two report types:
- Experiment Logging: Fixed interval data logs.
- Experiment Report: Complete experiment summary.
- Reports available for download via web interface.
- Email Alerts with generated reports.
Implementation Process
- Hardware Setup:
- Configure Modbus slaves (EM device with Unit ID: 2, Baud: 9600).
- Connect EM to RS485 port 2 of EE device.
- Connect rotation sensors, water flow/temperature sensors to EM.
- Power both devices with 24VDC.
- Network Configuration:
- Set up EM Wi-Fi connectivity.
- Configure EE network settings (Ethernet/Wi-Fi).
- Application Configuration:
- Set flow rate and temperature channel parameters on EM.
- Configure RPM channel selection.
- Set appropriate thresholds for sensors.
- Experiment Execution:
- Enter project details on EE web interface.
- Initiate experiment with “START NEW EXPERIMENT”.
- Option to continue previous experiment parameters.
Results and Benefits
The implementation provided with several key advantages:
- Comprehensive Data Collection:
- Detailed performance metrics across all aspects of washing machine operation.
- Time-stamped data for cycle-by-cycle analysis.
- Enhanced Testing Efficiency:
- Simultaneous monitoring of multiple parameters.
- Automated report generation.
- Reduced manual data collection requirements.
- Improved Analysis Capabilities:
- Standardized reporting format for consistent evaluation.
- Historical data access for comparative analysis.
- Detailed performance metrics for product optimization.
- Operational Flexibility:
- Configurable for different machine types.
- Adaptable to various testing requirements.
- Parameter adjustments without hardware modifications.
Technical Appendix
Hardware Specifications
Em Edison (EE) Features:
- Digital I/O: 6 channels (NPN 24V, 500mA max).
- Analog Input: 4 channels (15-bit resolution, 0-20mA/0-10V).
- Analog Output: 1 channel (12-bit resolution, 0-20mA/0-10V).
- RS485: 2 ports with variable baud rates.
- Network: Ethernet and Wi-Fi connectivity.
- Web Server for configuration.
Em Maxwell (EM) Features:
- Digital I/O: 6 channels (NPN 24V, 500mA max).
- Analog Input: 4 channels (15-bit resolution, 0-20mA/0-10V).
- Analog Output: 1 channel (12-bit resolution, 0-20mA/0-10V).
- RS485: 1 port.
- Web Server for configuration.
Software Interfaces
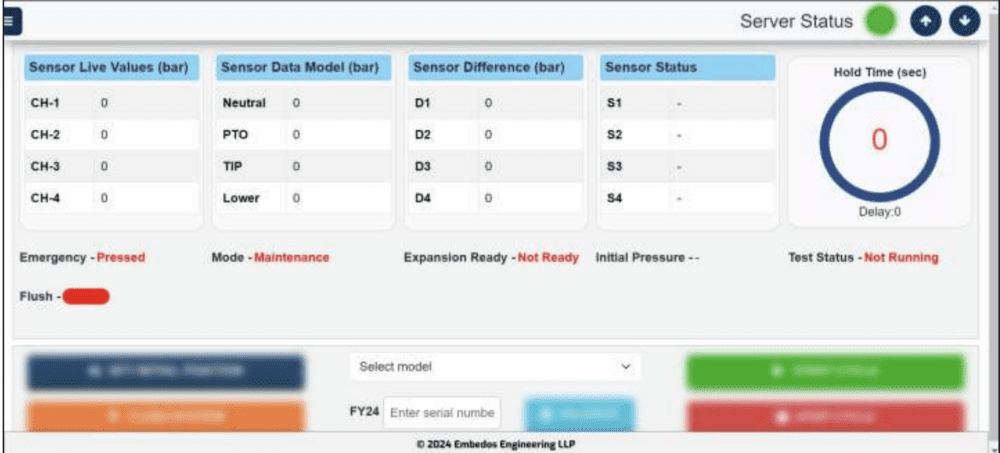
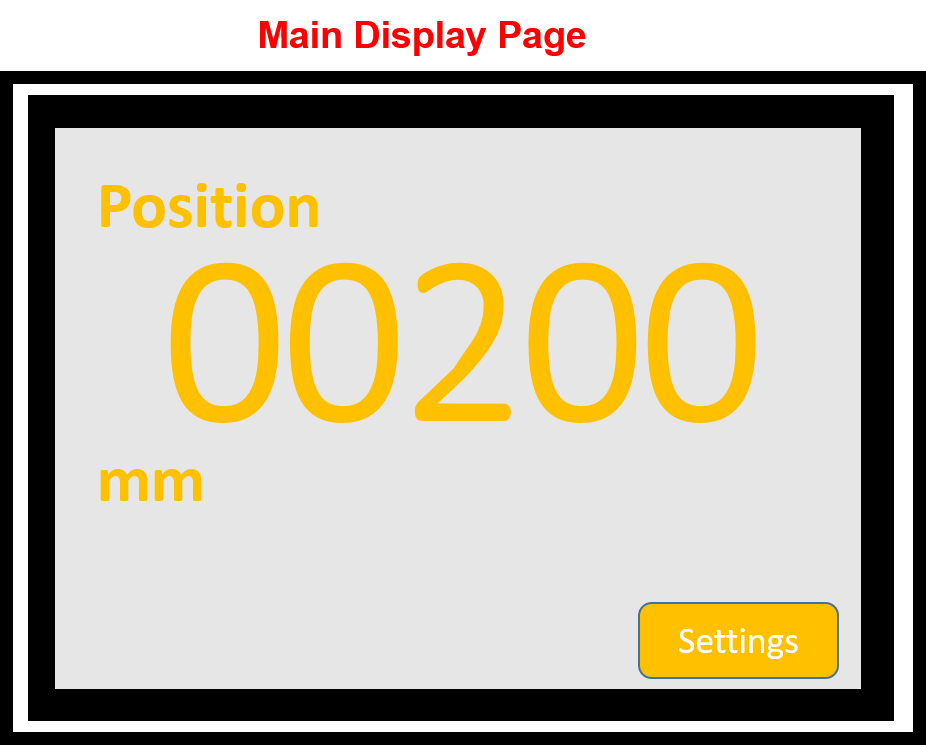
EE Web Application:
- Application/Logic page for experiment setup.
- Report page for downloading generated reports.
- Calibration page for analog I/O configuration.
- Network page for connectivity settings.
- Device page for system time configuration.
EM Web Application:
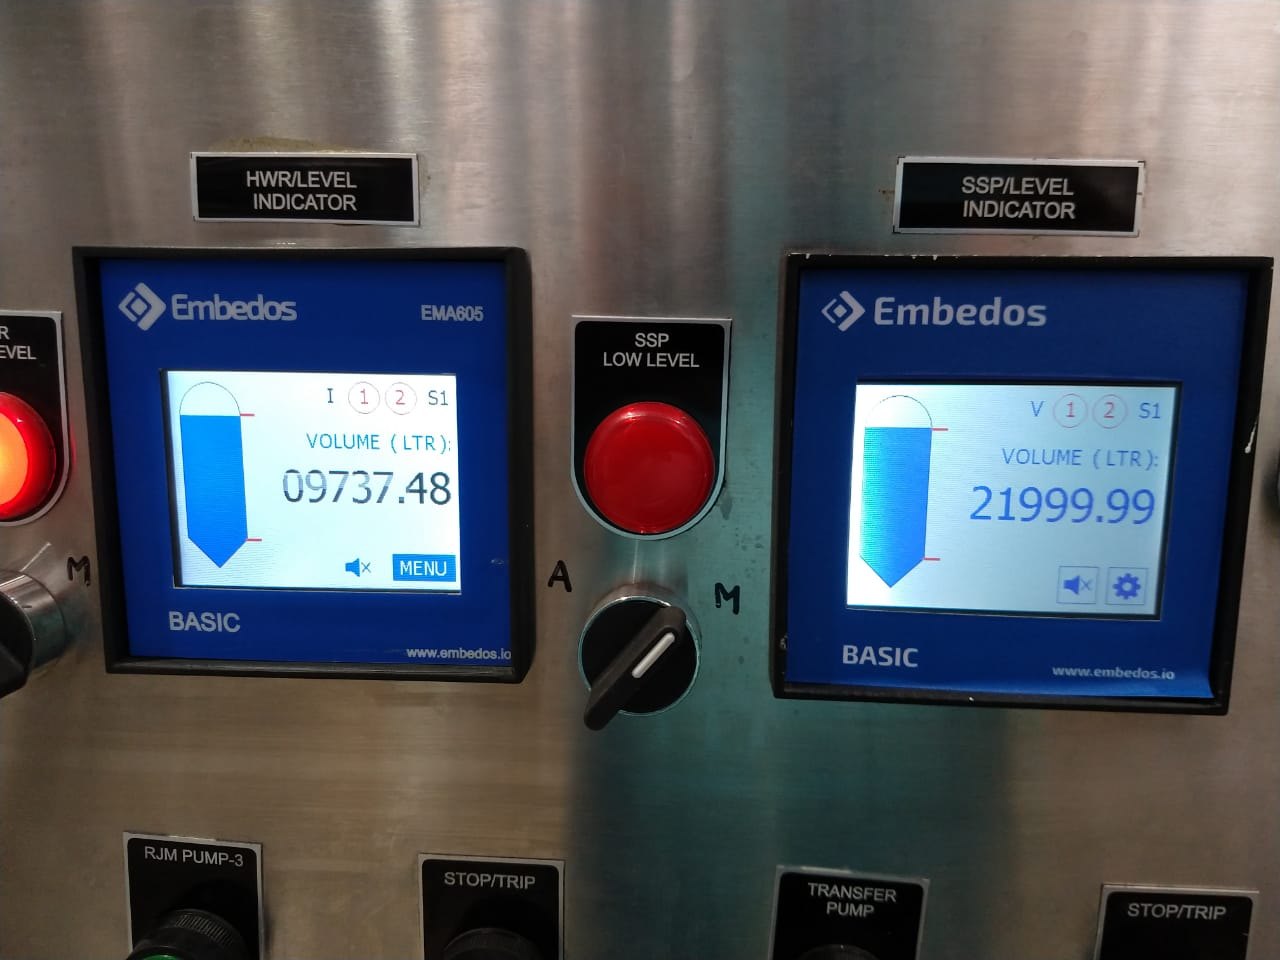
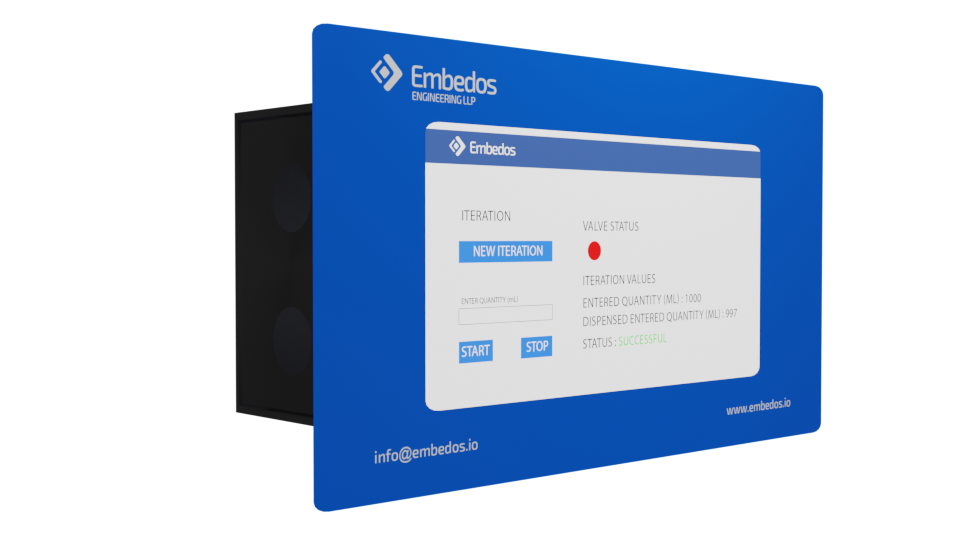
- Application Dashboard for real-time monitoring.
- Application Configuration for parameter settings.
- I/O Dashboard for direct I/O monitoring.
- Protocol Configuration for communication settings.
- Device Configuration for system settings.
Key Calculations
Water Consumption:
-
Formula:
INLET_WATER_TOTALIZED + (INLET_FLOW_RATE / (flow_to_volume_factor/loop_interval)). - Example: With 60 LPM flow rate and 10ms loop interval, 0.01 liters added per cycle.
Motor Monitoring:
- RPM calculation based on sensor trigger timing.
- Direction determination using relative timing between sensors.
- Accounting for gear ratios between motor and drum.
Conclusion
- Enhanced Asset Visibility: Achieved complete real-time monitoring of washing machine operations at the company’s facilities.
- Data-Driven Decisions: Predictive maintenance reduced unplanned downtime by 30%.
- Operational Efficiency: Automated logging minimized manual data collection efforts by 80%.
- Energy Optimization: Real-time tracking of energy consumption helped reduce unnecessary power usage.
- Scalability & Adaptability: Modular design allowed for easy expansion to additional washing stations.
This washing machine monitoring system demonstrates effective integration of IoT technologies for industrial testing applications. By combining sensor technology, data acquisition hardware, and automated reporting, using Embedos Edge Solutions, achieved a comprehensive solution for washing machine performance analysis.
The system’s modular design and configurability ensure adaptability to evolving testing requirements, while its robust data collection capabilities provide valuable insights for product and performance optimization.
Grab Your Copy Of The Case Study, Now!
Looking for End to End Industrial Automation & IoT Solutions?
Our Experts Want to speak to You!
Explore Other Case Studies