Data Center Noise Monitoring: Measure Against Indian Limits

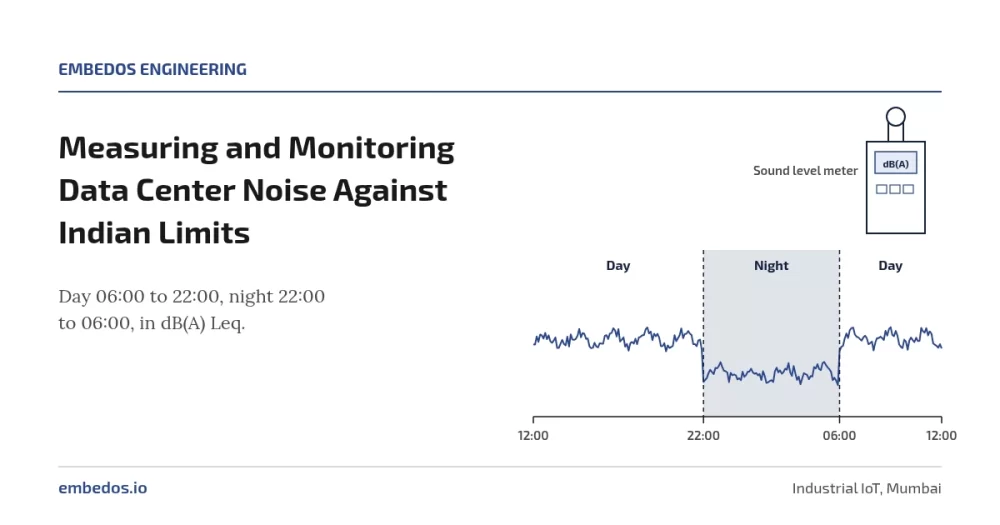
Use a third-party sound level meter that meets IEC 61672-1 (Class 1 for compliance and disputes, Class 2 for screening), measure A-weighted Leq over day (6:00 a.m. to 10:00 p.m.) and night (10:00 p.m. to 6:00 a.m.)

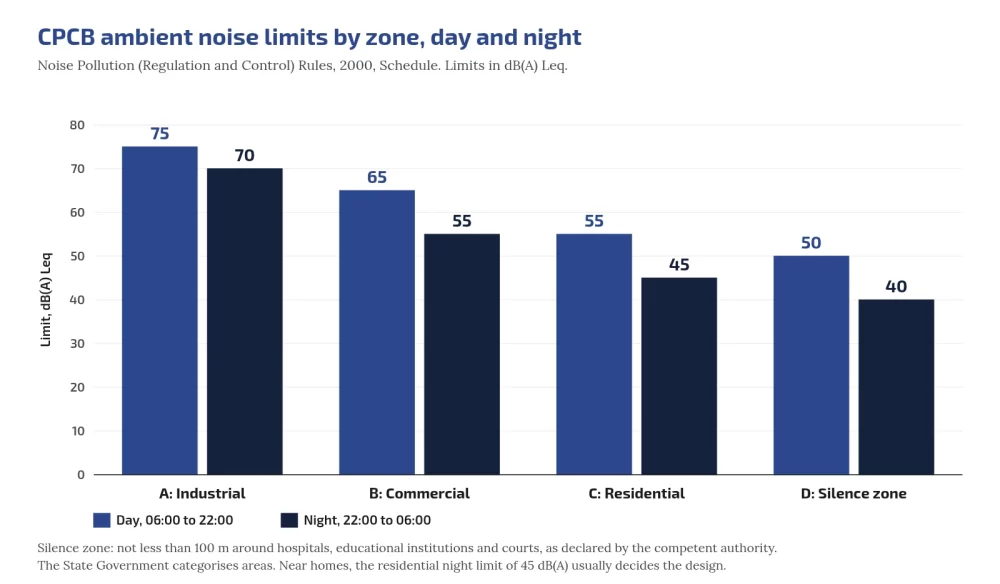
This is defined in India’s Noise Pollution (Regulation and Control) Rules, 2000, and compare with zone limits: industrial 75/70, commercial 65/55, residential 55/45, silence 50/40 dB(A) Leq (CPCB C1).

Add L90 for background, C-weighted levels and 1/3-octave spectra for low-frequency tones, and continuous logging with day/night alarms so you see problems before neighbours report them.

Who this is for: EHS managers, facility engineers and consultants responsible for noise compliance and community relations at data centers and plants with DG sets.
Hub: data center noise overview.

Tell us what you need on site

Need this on your site? Tell us your requirement

Embedos blogs embedos-blogs: CPCB ambient day and night limits by zone

Class 1 or Class 2 (the meter, not Embedos)

IEC 61672-1 sets performance classes for sound level meters; Class 1 has tighter tolerances than Class 2 (IEC webstore). Both cover A/C/Z weightings, Fast/Slow time weightings and integrating (Leq) functions; periodic tests are in IEC 61672-3.

If a result may face a regulator, court or resident consultant, use Class 1 with calibration certificate and field calibrator checks before and after. Permanent screening points may use Class 2 if you state that in reports.

Never label Embedos Edge as Class 1; the class belongs to the third-party meter. Embedos does the intelligence, the continuous logging!

Descriptors: Leq, L90, spectra

  • LAeq,T: A-weighted equivalent continuous level (NTi LAeq explainer).
  • L90: level exceeded 90% of the time (background floor) (NTi percentiles).
  • L10 / LAFmax: intermittent peaks and Fast maxima.
  • 1/3-octave or FFT: transformer tones at 100 Hz multiples; engine firing; fan BPF (hum; fans).
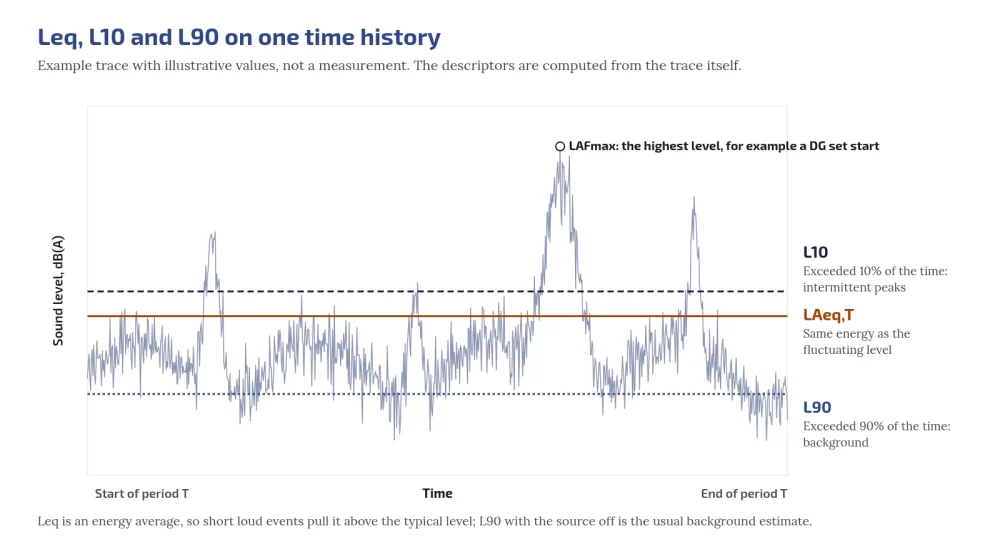
Embedos blogs embedos-blogs: Leq L10 L90 time history

Worked example: combining hourly Log

L_eq,total = 10 log10( (1/N) Σ 10^(L_i/10) ) (ISO 1996-1 definition). Eight night hours 44, 44, 45, 43, 43, 52, 44, 44 dB → about 46.2 dB. One loud genset hour can push a residential night over 45 dB(A).

Background correction 

Source+background 52 dB, background alone 46 dB → source ≈ 50.7 dB. When the difference is under about 3 dB, correction is unreliable (ISO 1996-2 residual sound).

Tonal penalties and the C−A screen

ISO 1996-2 Annex C can add 0 to 6 dB for tonal audibility (Pedersen, Acoustics 2008).

India’s 2000 Rules do not specify a tonal penalty; using one internally still predicts complaints. WHO 1999 §4.3 is widely cited for recommending frequency analysis when dB(C)−dB(A) > 10 dB (IRIS handle)

CPCB ambient limits

Zone Day Night
Industrial 75 70
Commercial 65 55
Residential 55 45
Silence 50 40

Sources: C1 PDF; Delhi PDF; HTML. Day 6:00 a.m.-10:00 p.m.; night 10:00 p.m.-6:00 a.m.

Silence zone ≥100 m around hospitals, educational institutions and courts;

State Government may declare (S.O. 2555(E) 10.08.2017 footnote).

Night is 5 dB lower than day in industrial zones and 10 dB lower in commercial, residential and silence zones (never “10-15”).

Rule 7(1): complaint if noise exceeds the ambient standard by 10 dB(A) or more, or night restriction violated.

Which limit matters most for a DC next to homes?

Usually the nearest residential night limit: 45 dB(A) Leq.

DG set limits

From CPCB Limits; Diesel Genset Noise Limits; Noise Limits for Generators:

  • New DG ≤1000 kVA manufactured on/after 1 Jan 2005: 75 dB(A) at 1 m from enclosure surface; integral acoustic enclosure.
  • Other sets: enclosure/room ≥25 dB(A) IL or ambient, whichever higher (0.5 m points averaged); muffler ≥25 dB(A) IL.

Do not cite GSR 436(E) for these dB values (supply/transition only).

WHO context

  • NNG 2009: target 40 dB Lnight,outside; interim 55 dB.
  • ENG 2018 / compendium W4: road <53 Lden / <45 Lnight; rail <54 / <44; aircraft <45 / <40; wind <45 Lden. ENG 2018 made no industrial noise guideline.

Use WHO as health reference; CPCB for compliance. Neighbours framing: health effects post.

Measurement checklist

  • Meter class stated (Class 1 for compliance); calibration current
  • Field calibrator before and after, recorded
  • Microphone 1.2 to 1.5 m above ground; windscreen; weather noted
  • Day and night periods per CPCB times
  • LAeq, LCeq, L90, L10, LAFmax
  • 1/3-octave spectra
  • Source on/off where possible
  • Operating state: IT load, cooling stages, transformer load, DG status
  • Zone category confirmed with competent authority
  • Tonal assessment method stated

Continuous logging architecture

Embedos Edge is our platform.

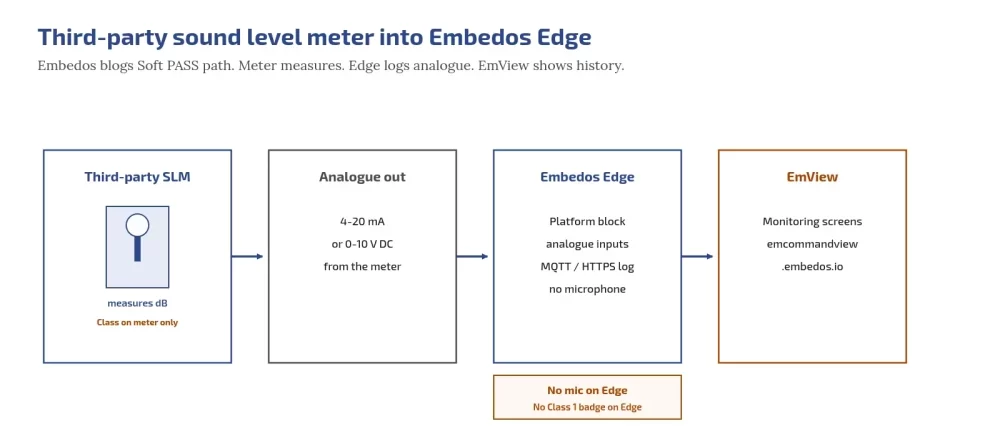
Edge can log readings from a third-party sound level meter, noise meter or recorder via 4-20 mA or 0-10 V analogue inputs.

Edge has no built-in microphone and does not do dosimetry; the meter measures. EmView monitoring/dashboard/SCADA (EmView=B) can show those logged readings at https://emcommandview.embedos.io/; report exports.

Class 1/2 under IEC 61672 refers only to the third-party meter. Scaling: https://tools.embedos.io/4-20ma-loop-scaling-calculator/.
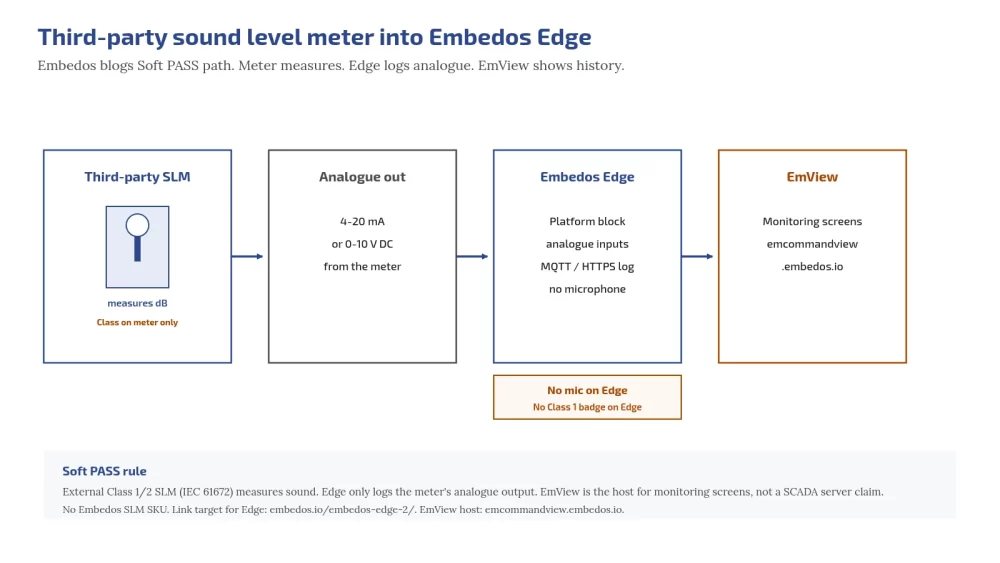
Embedos blogs embedos-blogs: third-party SLM analogue into Edge then EmView

Practical rules (set with your consultant):

  1. Outdoor monitoring-grade third-party meters at boundary and receiver-facing positions with analogue outputs.
  2. Edge logs those readings; compute period Leq, L90, C−A and selected bands in your analytics layer as agreed.
  3. Correlate with DG run and fan/chiller stage from existing plant systems.
  4. Separate day/night thresholds; projected night Leq warning; tonal/low-frequency flags.
Does Edge measure dB by itself?

No. A third-party meter measures; Edge logs its analogue output. Edge can add a microphone. 

Next step. Drop a Mail!

Send your zone category, proposed meter positions and whether you need Class 1 compliance logging or operations screening, and we will help you with Edge.

Email: team@embedos.io

Help Us Help You Leverage The Power Of Industrial Automation & Industrial IoT – IIoT.
Hydro Static Testing Data Logger| Hardware & Software

Hydrostatic Testing Automation Using Industrial Data Logger & Real-Time Pressure Analytics, Reports & Pump Control!

The pump behaves as an actuated endpoint within a software-defined test cycle, driven entirely by real-time pressure acquisition and deterministic control logic.

Objective

Design and deploy a hydrostatic testing platform capable of:

  • Closed-loop pump control based on pressure setpoints

  • Continuous pressure acquisition from analog sensors (4–20 mA)

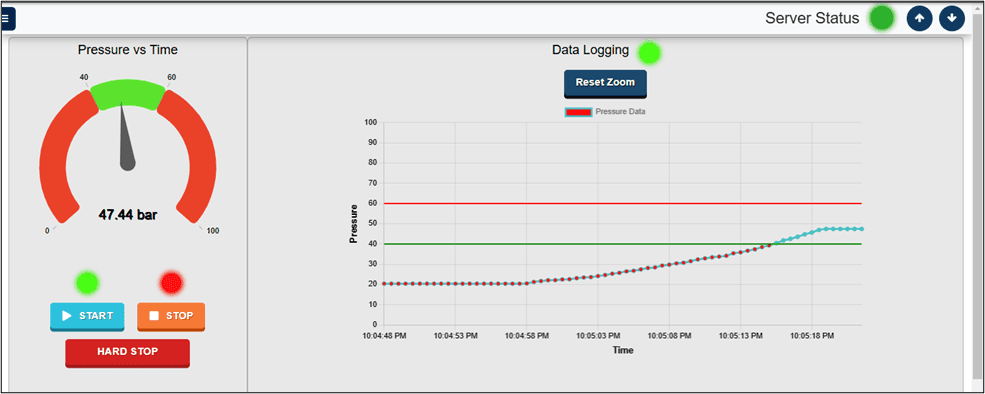
  • Real-time visualization of pressure vs time behavior

  • Automated logging and report generation

  • Repeatable test execution independent of operator experience.

The Embedos goal was to eliminate manual observation and create deterministic testing workflows suitable for industrial QA environments.

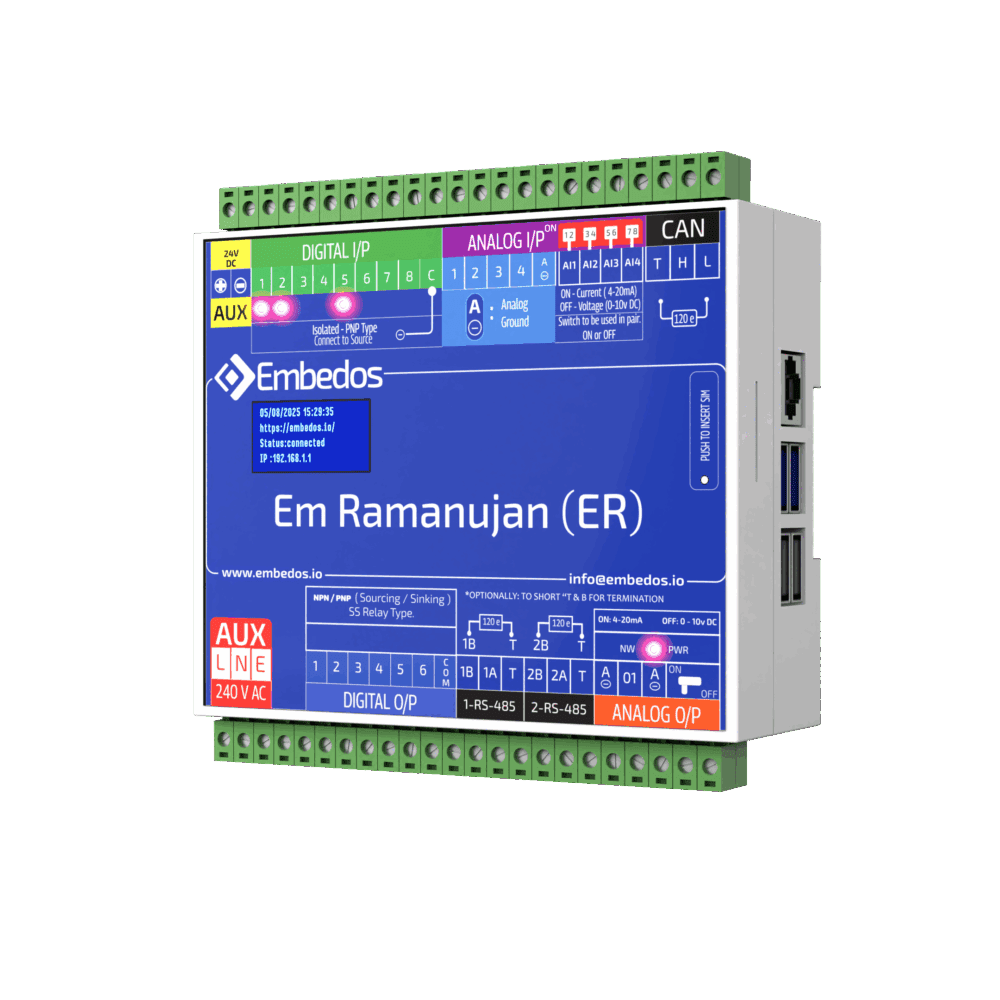
Embedos Mumbai_ Hydro static Testing Data Logger_Em Ramanujan

System Architecture

The deployed solution consists of an embedded industrial controller running a dedicated HMI application.

Hardware Layer

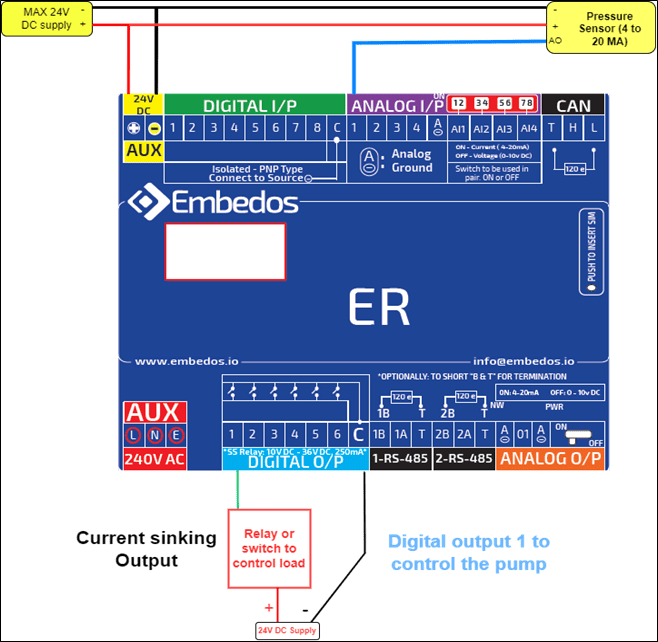
  • Analog Input: Pressure sensor (AI01)

  • Digital Output: Pump control (DO01, sinking output)

  • Power input: 24V DC or 240V AC compatible

  • Local HMI + keyboard/mouse interface

Control Logic Layer

  • Parameterized setpoint control

  • Automatic pump shutoff at target pressure

  • Emergency hard-stop interrupt logic

  • Configurable polling intervals

Software Layer

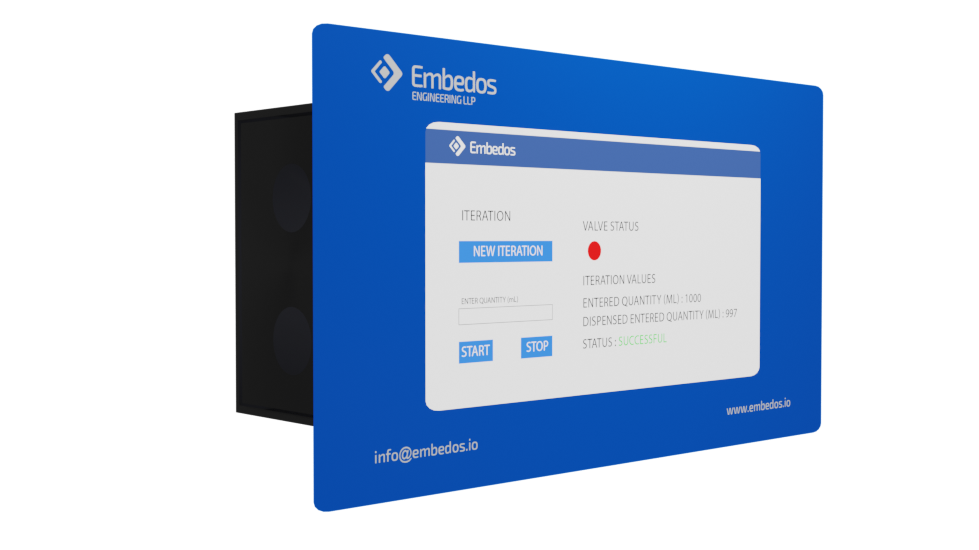
  • Real-time UI (local web application)

  • Pressure visualization gauge

  • Time-series graph plotting

  • Data logging service

  • Reporting engine with export support

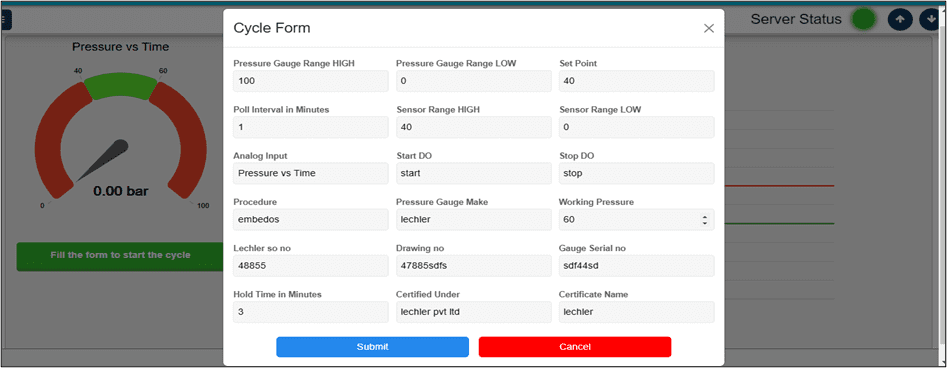
Embedos Mumbai_ Hydro static Testing Data Logger_Form1

Test Cycle Workflow (Control Logic)

The system executes a structured hydro-test cycle:

  1. Operator enters configuration parameters:

    • Gauge range high/low

    • Sensor scaling range

    • Setpoint pressure

    • Hold time

    • Polling interval

  2. START command initiates:

    • Pump activation via DO output

    • Pressure sampling

    • Graph plotting engine

    • Data logging process

  3. During cycle:

    • Pressure values displayed as live gauge + trend graph

    • Time axis scaled using user-defined polling interval

    • Continuous logging synchronized with RTC

  4. Setpoint reached:

    • Pump automatically de-energized

    • Hold-time countdown begins

    • Logging continues until completion

  5.  Completion:

    • Dataset committed to storage

    • Report indexed for export 

      Hard-stop input immediately terminates pump, logging, and plotting for safety override.

Data Acquisition & Visualization

Key implementation characteristics:

  • Pressure vs Time plot rendered in real time

  • X-axis: 24-hour time format

  • Y-axis: pressure in bar units

  • Sensor scaling configurable via software mapping

  • Live numerical values shown alongside analog-style gauge

This allows operators to detect:

  • Pressure instability

  • Pump performance anomalies

  • Leakage trends during hold phase

Reporting & Data Management

The reporting subsystem supports:

Individual report downloads

Batch export as ZIP packages

Monthly database dumps

Sortable report indexing by ID or date

Reporting & Data Management

The reporting subsystem supports:

  • Individual report downloads

  • Batch export as ZIP packages

  • Monthly database dumps

  • Sortable report indexing by ID or date

Calibration & Configuration

Engineering maintenance includes:

  • Two-point or zero/span calibration

  • Analog input mapping to process ranges

  • RTC synchronization for timestamp integrity

 This reduces drift-related inaccuracies and ensures long-term consistency across test cycles.

Technical Significance

This system effectively shifts hydrostatic testing from a human-observed process to a software-orchestrated control workflow.

Instead of:

Operator watches gauge → manually stops pump → logs readings.

The process becomes:

Sensor feedback → control logic → automatic actuation → timestamped data artifact.

The Embedos Hydro Testing Datalogger demonstrates how a focused embedded system can combine control logic, visualization, and data integrity into a single operator-facing tool.

Looking for End to End Industrial Automation & IoT Solutions? 


Our Experts Want to speak to You!

Explore Other Case Studies

Embedos_Em Ramanujan (ER) _ Front_1

Hydro Static Testing Data Logger| Hardware & Software

Hydrostatic Testing Automation Using Industrial Data Logger & Real-Time Pressure Analytics, Reports & Pump Control! The pump behaves as an actuated endpoint within a software-defined test cycle, driven entirely by real-time pressure acquisition and deterministic control logic.
Embedos Architecture for Steel Manufacturer for Nuclear Power Plant

IoT based Industrial Conveyor Belt Monitoring System

The Embedos monitoring system has transformed this maintenance strategy from reactive to proactive, particularly for critical conveyor belt systems essential to nuclear power plant production.

Air Control Valve Testing Through Automation. Embedos Case Study SS 1

Revolutionizing Air Control Valve Testing Through Automation. An Embedos Case Study

The Embedos ACV Testing Automation System represents a significant advancement in hydraulic component quality assurance.

EE+EM _ Use case for HUL _ Embedos

IoT-Based Washing Machine Testing: FMCG Performance Monitoring Case Study

Optimize your washing machine testing with IoT monitoring solutions that track water usage, RPM, temperature, and power consumption.

This case study showcases implementation of real-time data collection and comprehensive performance analysis for quality control and efficiency improvements.”

Vertical Tank Monitoring - Embedos - Em Bose ( EB ) 3.2″ HMI

Industrial Tank Level Monitoring with IoT

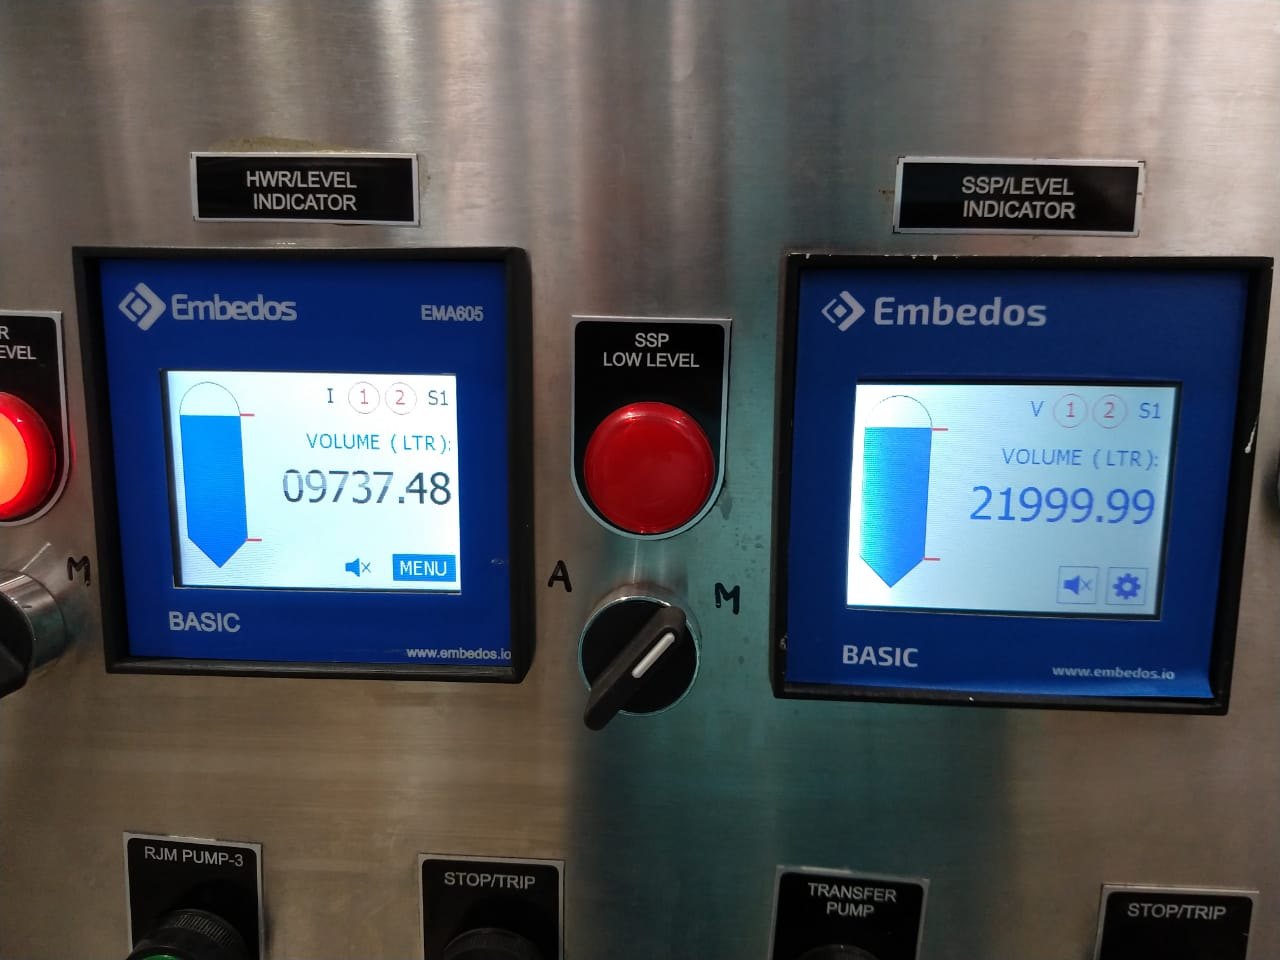
1) The Embedos EB Series ( EM Bose ) calcuates the volume of the liquid in the tank & displays its level. The calculation is done based on the inputs from a Pressure sensor that is mounted at the bottom of the tank.

2) The device displays real time values & level of the tank with a view of set points or Threshold Limits between which the liquid of interest should remain.

3) If the Liquid crosses either of the two setpoints, the device sets of a relay which is connected to a high wattage Industrial Lamp ( Bulb ) to indicate that the threshold has been crossed. Also, the device has a buzzer that goes off on the crossing.

Embedos Maxwel - EM - Modbus / CAN bus / IO Expander

Embedos IO Data Logger + 4G Gateway

The Embedos IO data logger is designed to log data to device as analog inputs, a pulse input which is to be converted to RPM value. The logger is able to also display real-time data on a webpage based utility.

The user can interact with the data-logger to configure and view all the settings and device parameters currently running on the device. The logger can store real-time data and send the same data via MQTT to a broker.

Embedo Em Dian – ( ED ) Enclosure

Dual Channel Analog Data Logger + 7” HMI

Deployment Type: Data Logger +7 Inch HMI Display

“Embedos Engineering – 7 inch Data logger HMI, Model ERA021. (Simultaneous 2 channels)

It has 7 inch touch screen display to monitor sensor data graphically. It has options to start and stop data logging facility.

(External Start Stop for each channel via DI) Has USB port for pen drive connection. You can download the data log in excel format for selected date and time. 2 nos. Digital outputs for set point. – Just NPN outputs.

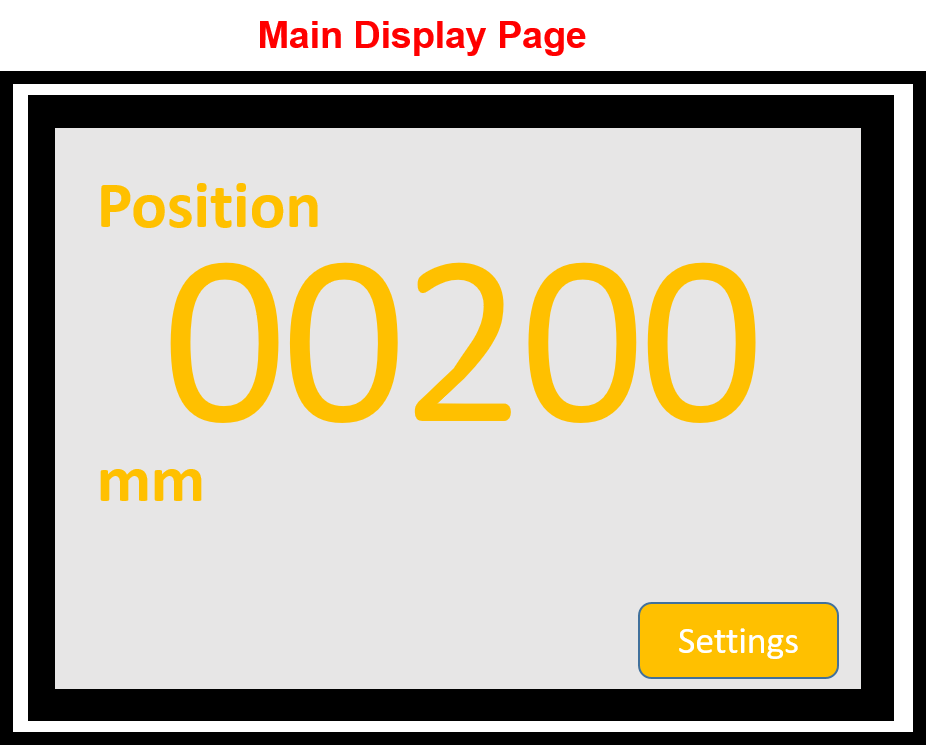
Embedos_CAN based Forklift Reach Height Controller Display - main page

Can Forklift Controller – Reach Height Display

Deployment Year: 2018

Deployment Type: Data Logger + Display

Problem Statement: In narrow warehouses with high racks, the view and space to maneuver are often restricted.

The Embedos Forklift controller and display based on CAN Bus helps the driver with appropriate displays and assistance systems. This makes load handling safer and more efficient.

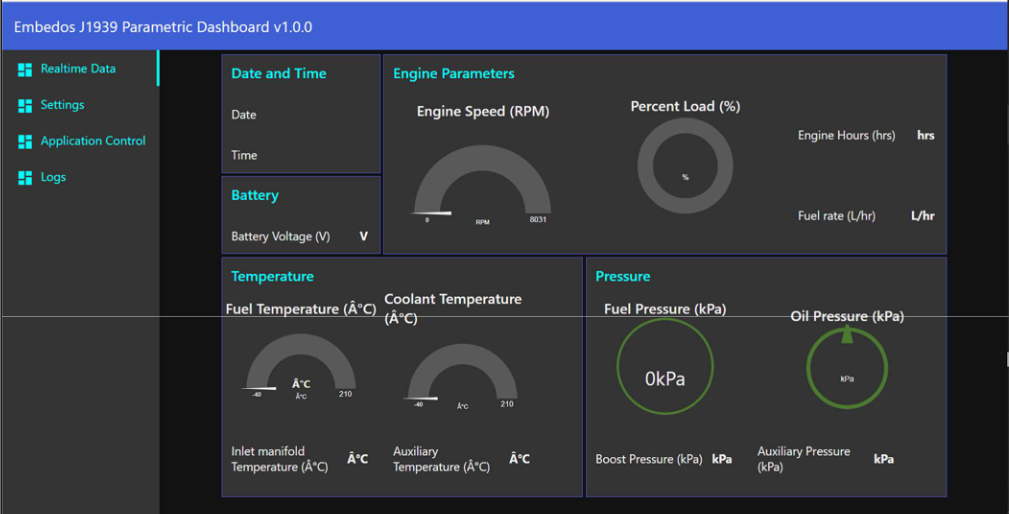
Embedos_CAN - J1939 Datalogging Dashboard showing decoded parameters in varied widgets

CAN-J1939 Data Logger & Modbus – TCP Gateway

This was deployed in 2021, to log a particular set of parameters from a Caterpillar Engine ECU and display logged data.

The Embedos Monitoring Software was used to visualize logged data from the ECU in the form of charts and gauges, display log files in .csv formats and give options & download all log files into the system

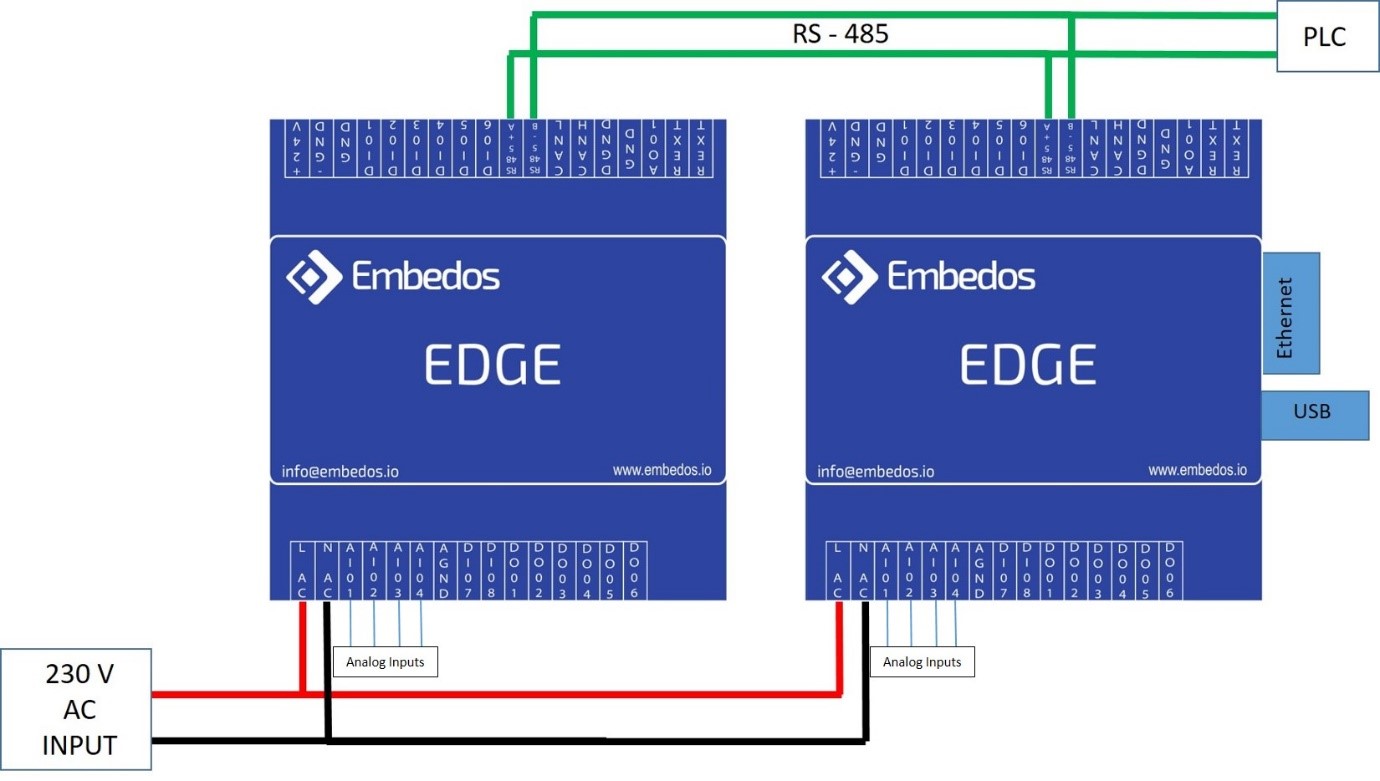
Embedos_Connection Diagram between Datalogger & Expansion Unit

Real Time Data Logger with Embedded Web App

Embedos Data Logger + Embedos Expansion IO Card take in an RS-485 input and  4 Analog Inputs Each to display Guages for 8 Analog Channels. Similarly displays a graph of the last 100 values of corresponding channels.

The Embedos Real Time software running on an Embedded Web Server on the master Data logger allows you to download data shown on the table in Excel, CSV or PDF formats directly.

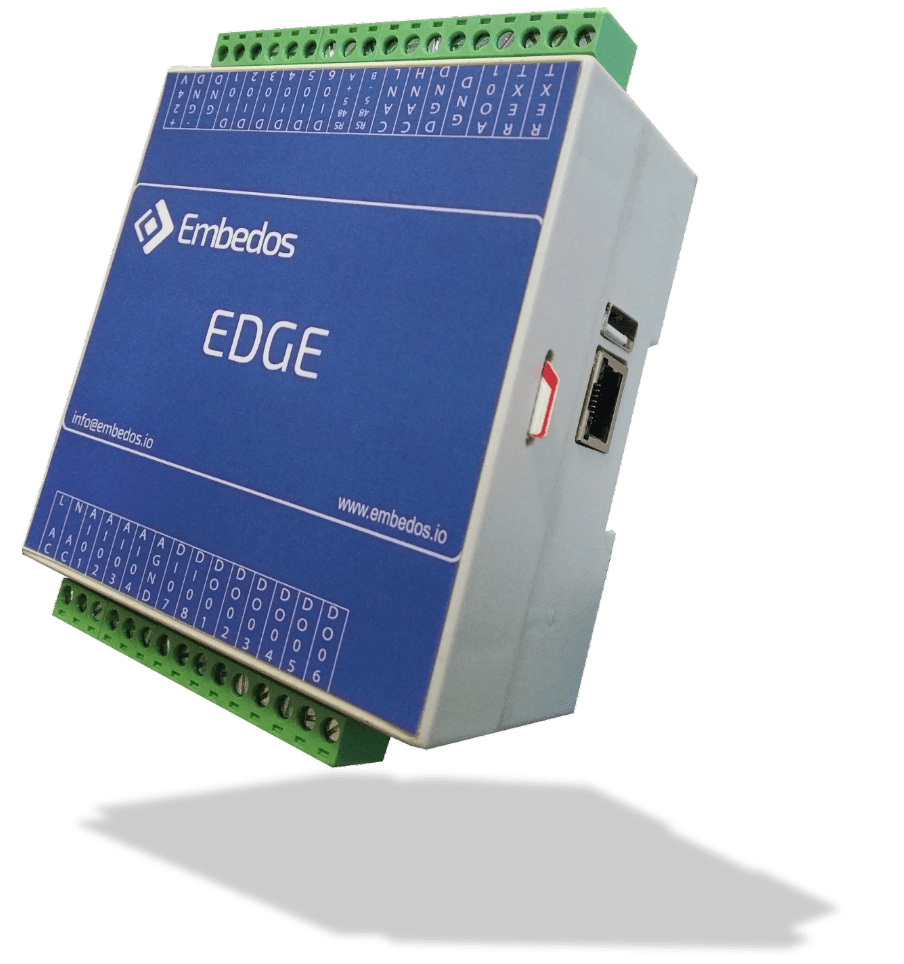
Embedos_EDGE

Edge_Glove Test Controller

Deployment Year: 2019 – 2022

Deployment Type: Multiple IO Data Logger + Browser based Web App.

The EDGE as a GLT controller provides an internal Modbus Server to read the analog and Digital inputs and control digital outputs.

EDGE calibration, test and network configuration options have been added to the latest iteration of this application of the EDGE.

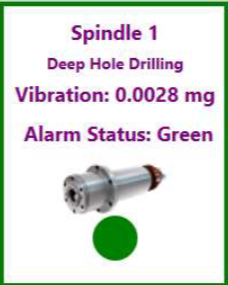
EmView-Vibration Monitoring Software - Spindle 1

Vibration Monitoring Software

The monitoring software stores historical data of each of the vibration units connected to it.

You can view this data in graphical form by right clicking on a card and selecting View History (Alternately, you can also Double Click on a card to open Graph window)

IoT based Industrial Conveyor Belt Monitoring System

How Embedos Transformed Maintenance for A

Nuclear Power Plant Steel Supplier!

Executive Summary

Embedos Engineering LLP implemented their advanced asset monitoring solution for a leading steel manufacturer supplying critical components to nuclear power plants.

This case study examines how Embedos’s integrated three-device system—Em Edison (EE), Em Maxwell (EM), and Em Turing (ET), revolutionized the monitoring of high-capacity conveyor belts, preventing costly equipment failures, reducing maintenance costs, and ensuring timely delivery of components.

The Challenge

The steel manufacturer faced unique challenges in their conveyor belt system that directly impacted their nuclear power plant supply chain:

  • Unpredictable conveyor belt failures resulting in production delays for critical nuclear components.
  • High temperatures in the steel production environment causing accelerated bearing wear.
  • Stringent quality and reliability requirements from nuclear power plant clients.
  • Costly emergency maintenance procedures and replacement parts.
  • Need for 24/7 monitoring to maintain continuous production workflows.

The Solution: Conveyor Belt Monitoring System for Nuclear Power Plants

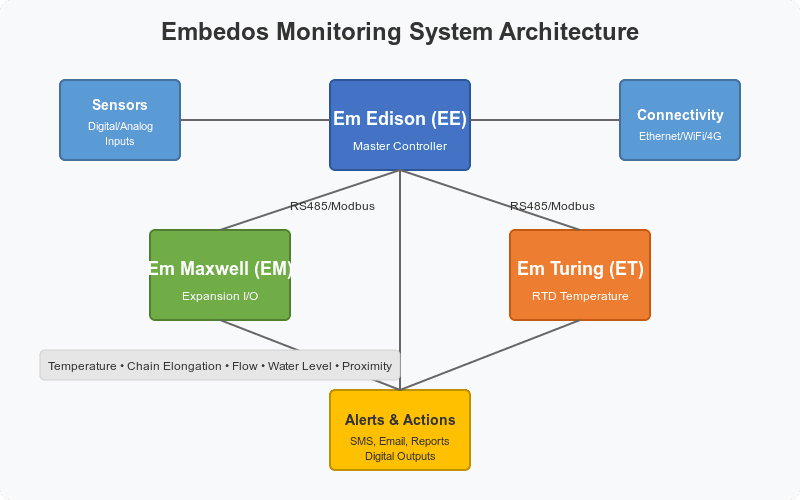
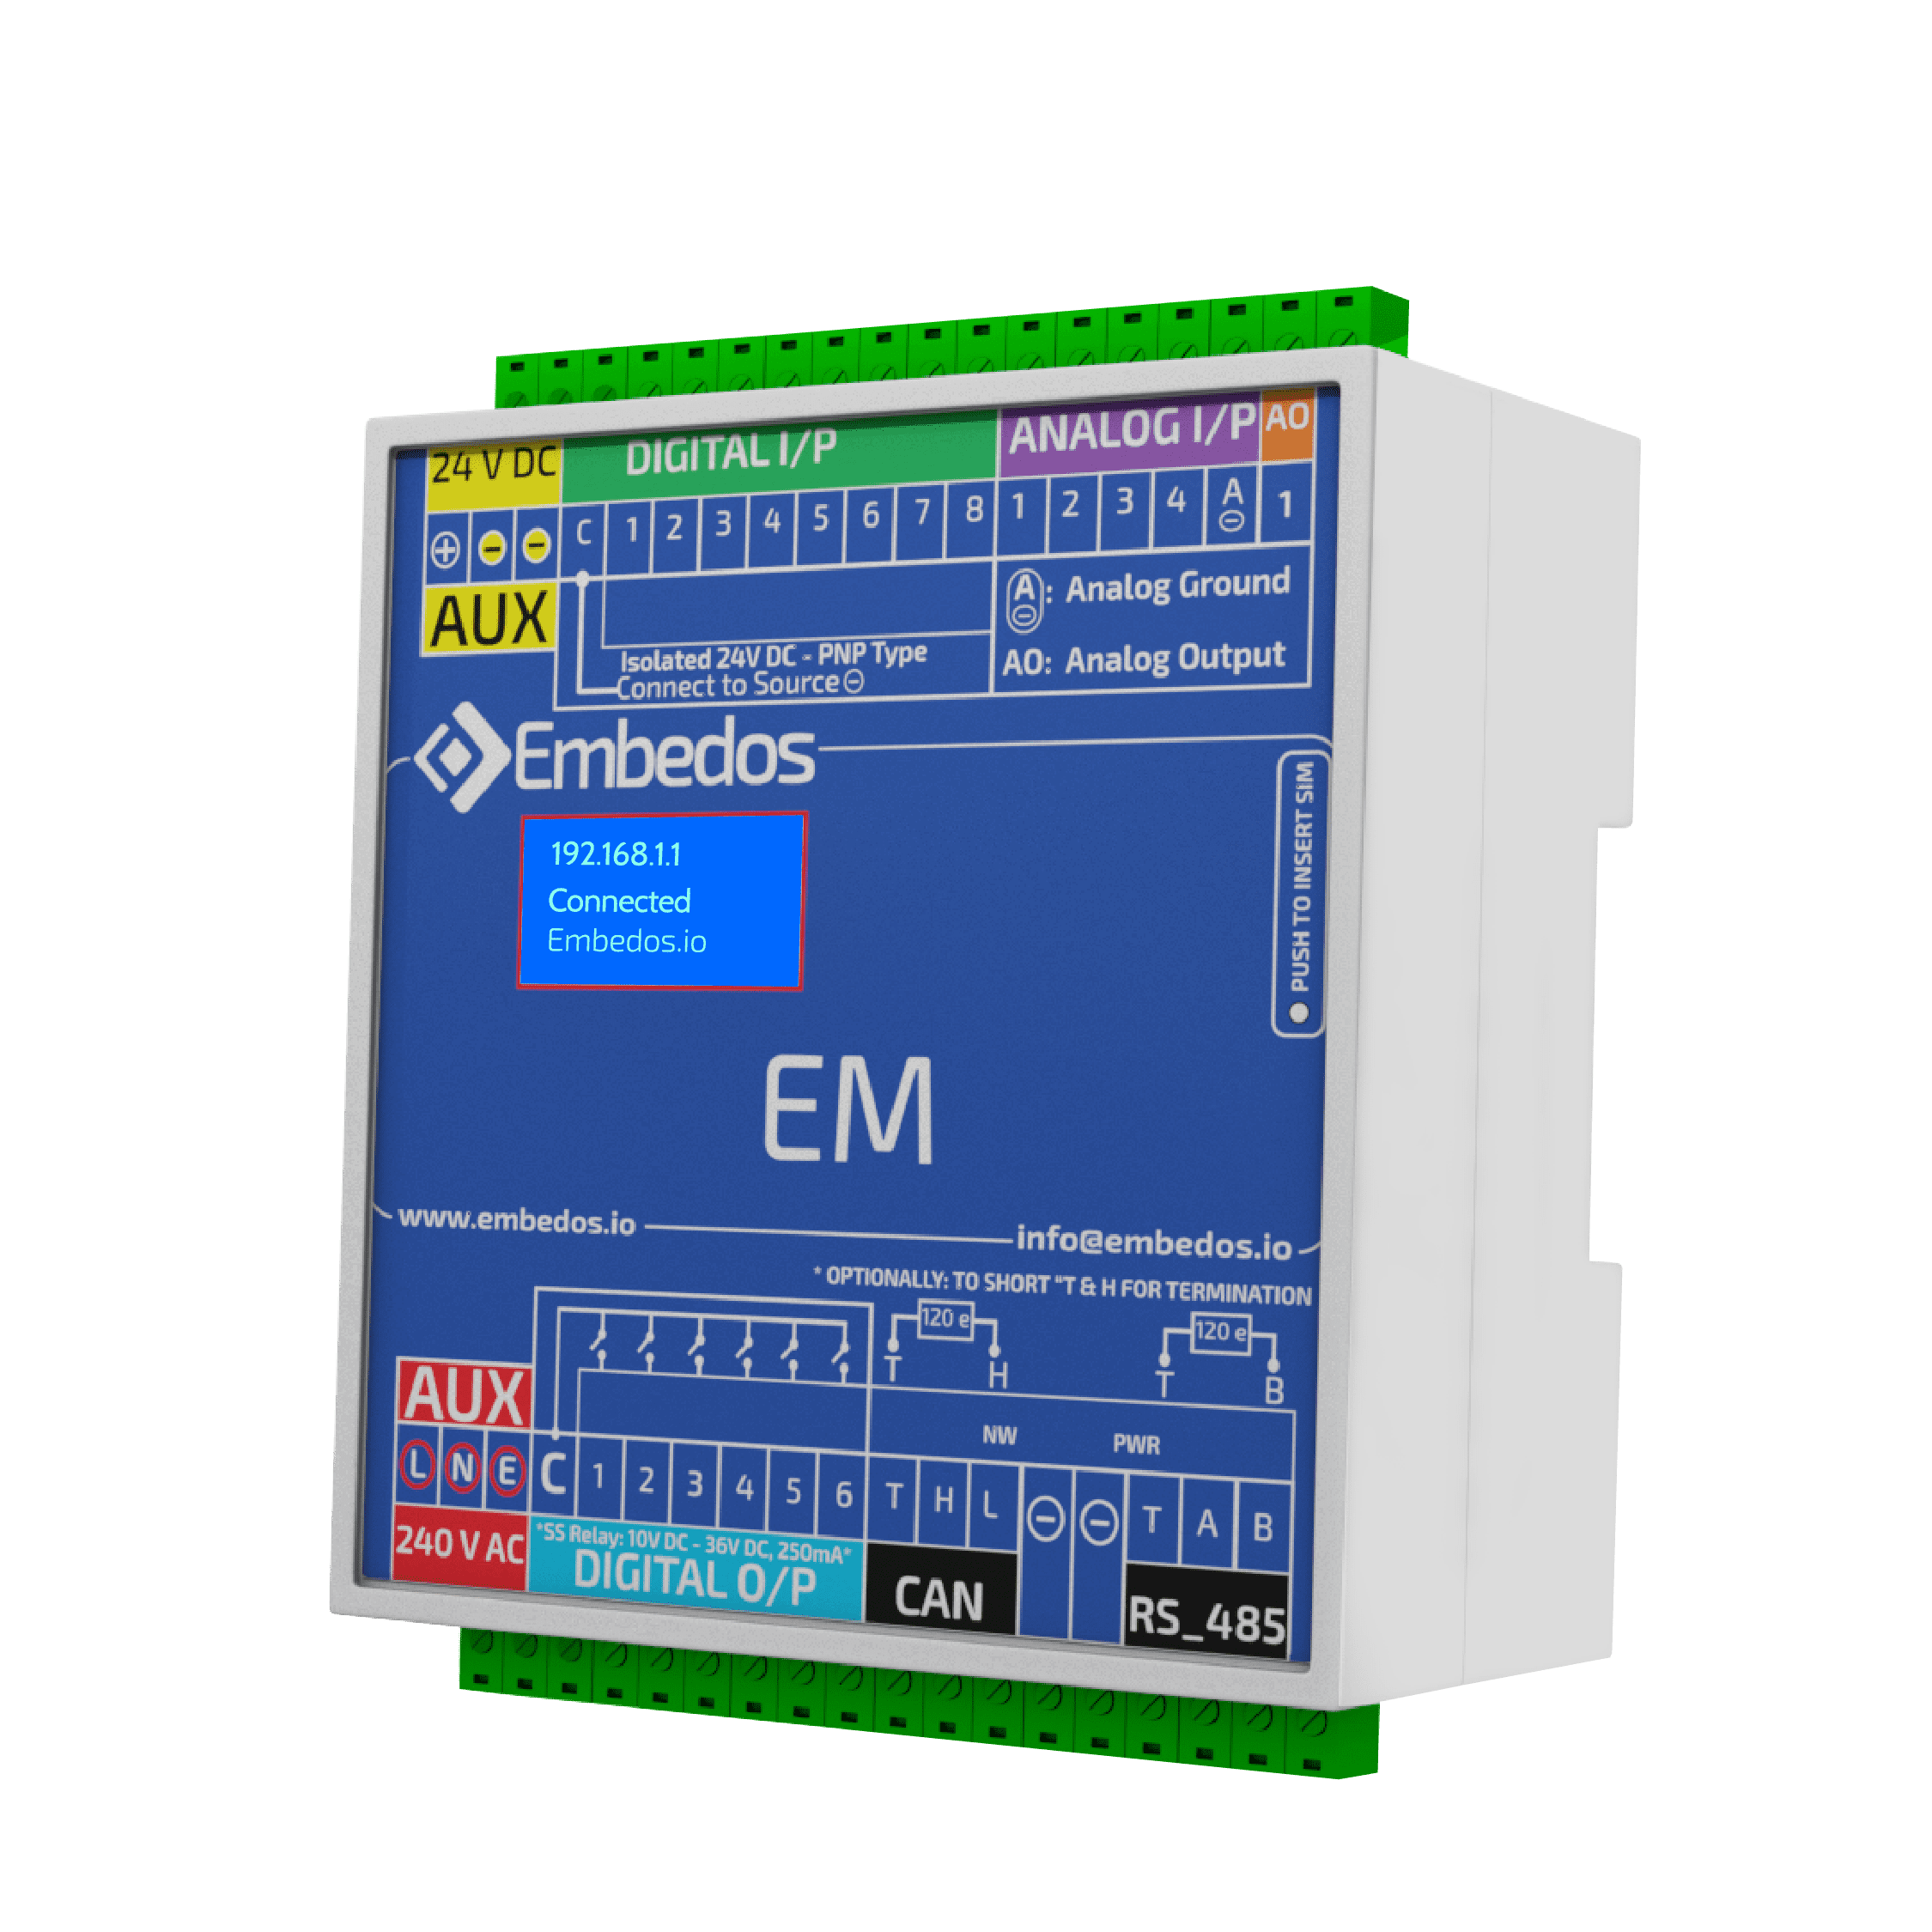
Embedos implemented their comprehensive monitoring solution featuring three specialized devices communicating over MODBUS to ensure reliable operation of the conveyor belt system:

  1. Em Edison (EE) – Master controller handling alerts, data logging, and communication.
  2. Em Maxwell (EM) – Expansion unit for additional I/O and specialized sensor inputs.
  3. Em Turing (ET) – Temperature monitoring unit with RTD inputs for bearing block monitoring.

The system monitors critical conveyor belt parameters including:

  • Temperature readings from 16 critical bearing blocks along the conveyor system.
  • Chain elongation measurements to detect wear before failure.
  • Flow switch status for cooling systems.
  • Water level detection in containment areas.
  • Height proximity sensors for material load monitoring.
  • SOI (Speed Of Impact) sensor inputs for material flow analysis.

Key Features Implemented for the Steel Manufacturer

  1. Nuclear-Grade Alarm System
    • Eight distinct alarm types with configurable thresholds customized for steel production.
    • Time delays calibrated to prevent false alarms in high-temperature environments.
    • Latching alarms that remain active until manually reset by authorized personnel.
    • Prioritized alerts for parameters critical to nuclear-grade steel production.
  2. Redundant Communication Channels for Continuous Monitoring
    • Ethernet connectivity integrated with the plant’s existing network infrastructure.
    • Secured WiFi for wireless monitoring in the steel manufacturing facility.
    • 4G cellular for remote monitoring and emergency SMS alerts to maintenance teams.
    • RS485/Modbus for reliable inter-device communication in electrically noisy environments.
  3. Comprehensive Reporting for Regulatory Compliance
    • Automated data logging at 5-minute intervals for critical bearing temperatures.
    • Complete event and alarm logging with timestamps for audit trails.
    • Shift-wise, daily, weekly, and monthly report generation.
    • Automated email delivery of reports to maintenance teams, management, and quality control.
  4. Steel Industry-Specific Web Interface
    • Real-time monitoring dashboard showing conveyor belt system status.
    • Configuration pages for customizing alarm thresholds to specific production runs.
    • Visual status indicators for maintenance scheduling.
    • Mobile-friendly access for on-floor monitoring by maintenance personnel.

Implementation in the Steel Manufacturing Environment

The implementation process was tailored to the steel manufacturing facility’s specific needs:

  1. Hardware Configuration for High-Temperature Environments
    • High-temperature rated sensors installed at critical bearing points.
    • Redundant power supplies to ensure continuous monitoring.
    • Specialized mounting systems to minimize vibration interference.
  2. Network Integration with Existing Steel Plant Infrastructure
    • Secure connection to the plant’s industrial network.
    • Isolated monitoring subnet to prevent cybersecurity vulnerabilities.
    • Integration with the company’s maintenance management system.
    • Backup communication channels for critical alerts.
  3. Nuclear Supplier Compliance Alarm Configuration
    • Customized alarm thresholds based on conveyor belt manufacturer specifications.
    • Time delays optimized through analysis of historical failure data.
    • Alert routing configured for 24/7 coverage across maintenance shifts.
    • Integration with plant-wide alert systems.
  4. Comprehensive Testing Protocol
    • Simulated failure testing for each monitored parameter.
    • Load testing during actual production conditions.
    • Verification of alert delivery across all communication channels.
    • Validation of data logging accuracy and reporting completeness.

Results and Benefits for Nuclear Supply Chain

The Embedos monitoring system delivered substantial improvements to the steel manufacturer’s operations:

  1. 37% Reduction in Conveyor Belt Downtime
    • Early detection of bearing temperature anomalies prevented catastrophic failures.
    • Proactive maintenance scheduling reduced emergency repairs by 64%
    • Critical alerts allowed for planned maintenance during scheduled production breaks.
    • Zero unplanned downtime events affected nuclear component delivery deadlines.
  2. Improved Maintenance Planning for Critical Infrastructure
    • Historical data enabled development of predictive maintenance schedules.
    • Weekly bearing temperature trend reports supported proactive replacement.
    • Complete maintenance history helped identify and resolve recurring issues.
    • 42% reduction in annual maintenance costs for conveyor system.
  3. Enhanced Safety in High-Temperature Steel Production
    • Continuous monitoring of bearing temperatures prevented potential fire hazards.
    • Immediate alerts for dangerous conditions allowed for rapid response.
    • Redundant alarm systems ensured critical parameter monitoring.
    • Zero safety incidents related to conveyor system failure since implementation.
  4. Significant Cost Savings Across Operations
    • 28% extension of conveyor belt and bearing life through optimized maintenance.
    • 64% reduction in emergency repair costs.
    • 37% decrease in spare parts inventory requirements.
  5. Nuclear Industry Supply Chain Reliability
    • Significantly improved conveyor system availability since implementation.
    • Complete documentation of system performance for nuclear industry audits.
    • Enhanced reputation as a reliable supplier to nuclear power plants.
    • Increased competitive advantage in the nuclear-grade steel market.

Technical Specifications for Steel Manufacturing Environment

  • Digital Inputs: Ruggedized 24VDC compatible inputs for proximity sensors, flow switches, and level sensors.
  • Digital Outputs: Industrial-grade 24V NPN outputs (500mA max) for alarms and control signals.
  • Analog Inputs: 4-20mA inputs with 15-bit resolution for precise monitoring.
  • RTD Inputs: 3-wire RTD temperature sensor inputs for bearing monitoring.
  • Communication: Dual isolated RS485 ports with Modbus RTU support.
  • Connectivity: Industrial Ethernet, secured WiFi, and 4G/LTE with backup power.
  • Power Requirements: 24VDC, 1A supply with UPS backup.

Conclusion: Transforming Steel Manufacturing for Nuclear Power Plant Supply

The Embedos monitoring system has transformed this maintenance strategy from reactive to proactive, particularly for critical conveyor belt systems essential to nuclear power plant production.

By providing real-time monitoring, immediate alerts, and comprehensive reporting tailored to the demands of nuclear industry suppliers, the system has significantly improved reliability, reduced costs, and enhanced the company’s competitive position in the nuclear-grade steel market.


Want the full technical details of this conveyor belt monitoring implementation?

Complete the form below to receive the comprehensive case study with technical specifications, configuration guides, and implementation details specific to steel manufacturing facilities supplying nuclear power plants.

  • Customized alarm configuration guidelines for conveyor belt systems.
  • Network security setup instructions for nuclear supplier compliance.
  • Web interface documentation with user permission levels.
  • Complete reporting capabilities for regulatory compliance.

“The Embedos conveyor belt monitoring system has transformed our maintenance approach from reactive to proactive. We’ve decreased downtime by 37%, extended equipment life significantly, and maintained our perfect delivery record to nuclear power plant clients.“

Grab Your Copy Of The Case Study, Now!

EM, EE & ET Device Connections _ Embedos _Conveyor Monitoring System

Sensor Configuration_ Embedos _Conveyor Monitoring System

Real TIme Display _ Embedos _Iot based Conveyor Monitoring System

SMS Configuration_ Embedos _Iot based Conveyor Monitoring System

Email Configuration_ Embedos _IoT based Conveyor Monitoring System

Your goals are of utmost importance to us

Looking for End to End Industrial Automation & IoT Solutions? 


Our Experts Want to speak to You!

Explore Other Case Studies

Embedos_Em Ramanujan (ER) _ Front_1

Hydro Static Testing Data Logger| Hardware & Software

Hydrostatic Testing Automation Using Industrial Data Logger & Real-Time Pressure Analytics, Reports & Pump Control!

The pump behaves as an actuated endpoint within a software-defined test cycle, driven entirely by real-time pressure acquisition and deterministic control logic.

Embedos Architecture for Steel Manufacturer for Nuclear Power Plant

IoT based Industrial Conveyor Belt Monitoring System

The Embedos monitoring system has transformed this maintenance strategy from reactive to proactive, particularly for critical conveyor belt systems essential to nuclear power plant production.

Air Control Valve Testing Through Automation. Embedos Case Study SS 1

Revolutionizing Air Control Valve Testing Through Automation. An Embedos Case Study

The Embedos ACV Testing Automation System represents a significant advancement in hydraulic component quality assurance.

EE+EM _ Use case for HUL _ Embedos

IoT-Based Washing Machine Testing: FMCG Performance Monitoring Case Study

Optimize your washing machine testing with IoT monitoring solutions that track water usage, RPM, temperature, and power consumption.

This case study showcases implementation of real-time data collection and comprehensive performance analysis for quality control and efficiency improvements.”

Vertical Tank Monitoring - Embedos - Em Bose ( EB ) 3.2″ HMI

Industrial Tank Level Monitoring with IoT

1) The Embedos EB Series ( EM Bose ) calcuates the volume of the liquid in the tank & displays its level. The calculation is done based on the inputs from a Pressure sensor that is mounted at the bottom of the tank.

2) The device displays real time values & level of the tank with a view of set points or Threshold Limits between which the liquid of interest should remain.

3) If the Liquid crosses either of the two setpoints, the device sets of a relay which is connected to a high wattage Industrial Lamp ( Bulb ) to indicate that the threshold has been crossed. Also, the device has a buzzer that goes off on the crossing.

Embedos Maxwel - EM - Modbus / CAN bus / IO Expander

Embedos IO Data Logger + 4G Gateway

The Embedos IO data logger is designed to log data to device as analog inputs, a pulse input which is to be converted to RPM value. The logger is able to also display real-time data on a webpage based utility.

The user can interact with the data-logger to configure and view all the settings and device parameters currently running on the device. The logger can store real-time data and send the same data via MQTT to a broker.

Embedo Em Dian – ( ED ) Enclosure

Dual Channel Analog Data Logger + 7” HMI

Deployment Type: Data Logger +7 Inch HMI Display

“Embedos Engineering – 7 inch Data logger HMI, Model ERA021. (Simultaneous 2 channels)

It has 7 inch touch screen display to monitor sensor data graphically. It has options to start and stop data logging facility.

(External Start Stop for each channel via DI) Has USB port for pen drive connection. You can download the data log in excel format for selected date and time. 2 nos. Digital outputs for set point. – Just NPN outputs.

Embedos_CAN based Forklift Reach Height Controller Display - main page

Can Forklift Controller – Reach Height Display

Deployment Year: 2018

Deployment Type: Data Logger + Display

Problem Statement: In narrow warehouses with high racks, the view and space to maneuver are often restricted.

The Embedos Forklift controller and display based on CAN Bus helps the driver with appropriate displays and assistance systems. This makes load handling safer and more efficient.

Embedos_CAN - J1939 Datalogging Dashboard showing decoded parameters in varied widgets

CAN-J1939 Data Logger & Modbus – TCP Gateway

This was deployed in 2021, to log a particular set of parameters from a Caterpillar Engine ECU and display logged data.

The Embedos Monitoring Software was used to visualize logged data from the ECU in the form of charts and gauges, display log files in .csv formats and give options & download all log files into the system

Embedos_Connection Diagram between Datalogger & Expansion Unit

Real Time Data Logger with Embedded Web App

Embedos Data Logger + Embedos Expansion IO Card take in an RS-485 input and  4 Analog Inputs Each to display Guages for 8 Analog Channels. Similarly displays a graph of the last 100 values of corresponding channels.

The Embedos Real Time software running on an Embedded Web Server on the master Data logger allows you to download data shown on the table in Excel, CSV or PDF formats directly.

Embedos_EDGE

Edge_Glove Test Controller

Deployment Year: 2019 – 2022

Deployment Type: Multiple IO Data Logger + Browser based Web App.

The EDGE as a GLT controller provides an internal Modbus Server to read the analog and Digital inputs and control digital outputs.

EDGE calibration, test and network configuration options have been added to the latest iteration of this application of the EDGE.

EmView-Vibration Monitoring Software - Spindle 1

Vibration Monitoring Software

The monitoring software stores historical data of each of the vibration units connected to it.

You can view this data in graphical form by right clicking on a card and selecting View History (Alternately, you can also Double Click on a card to open Graph window)

Revolutionizing Air Control Valve Testing Through Automation. An Embedos Case Study

Case Study: Automating Hydraulic Testing Systems.

Revolutionizing Air Control Valve Testing Through Automation

Executive Summary

This case study examines how Embedos Engineering’s specialized automation solution transformed the testing processes for Air Control Valves (ACVs) at a leading hydraulic equipment manufacturer in India. The implementation of the ACV Testing Automation System enhanced testing precision, increased operational efficiency, and improved quality assurance protocols, resulting in significant time savings and more reliable product performance.

Client Profile

A prominent hydraulic systems manufacturer based in Mumbai, India, specializing in the production of high-performance hydraulic equipment for commercial vehicles and industrial applications. The company has established itself as an industry leader with a focus on innovation and quality control.

About Embedos Engineering

Embedos Engineering LLP, headquartered in Mumbai, is a pioneering force in End-to-End Industrial IoT Solutions. The company specializes in developing cutting-edge smart devices and cloud-based web solutions tailored for remote monitoring, control, and Industry 4.0 applications. Embedos Engineering’s core mission is to facilitate the seamless digitization of existing factory and process automation systems, enabling businesses to embrace the future of connectivity and efficiency.

Challenge

Testing Complexity and Reliability Issues

The client faced several critical challenges in their ACV testing processes:

  1. Manual Testing Inefficiencies: Traditional manual testing methods for Air Control Valves were time-consuming, labor-intensive, and prone to human error.
  2. Inconsistent Test Results: Lack of standardization in testing procedures led to variable outcomes and difficulty in establishing reliable quality benchmarks.
  3. Limited Data Collection: The existing process provided minimal documentation of test parameters and results, hindering quality tracking and continuous improvement initiatives.
  4. Scalability Concerns: As production volumes increased, the manual testing approach became a bottleneck in the manufacturing pipeline.

Solution

Embedos ACV Testing Automation System Work Bench

Embedos Engineering developed an end-to-end automation solution to address these challenges, consisting of:

Hardware Components

  • Embedos Edge Devices: Dual-configuration setup with master and slave devices to control and monitor testing operations.
  • Digital and Analog I/O Configuration: Comprehensive input/output mapping for precise control and data acquisition.
  • Pressure Transducers: Four strategically positioned sensors (PT1-PT4) to measure pressure at critical valve positions.
  • Solenoid Valves: Automated control of testing media flow and pressure application.

Software Elements

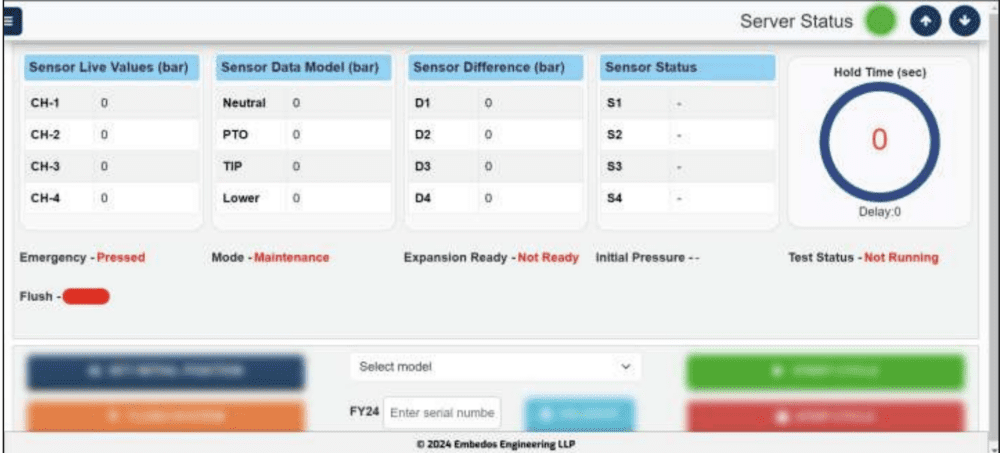
  • Embedos Real-time Dashboard: Intuitive interface displaying live sensor values, test statuses, and operational parameters.
  • Configuration Management Portal: User-friendly controls for adjusting critical test parameters including:
    • Flushing time
    • Hold time
    • Delay time
    • Error point thresholds
  • Automated Test Sequencing: Predefined test cycles with position control for Initial, PTO, Tipping, and Lowering positions.
  • Comprehensive Reporting System: Automated generation of test reports with options for PDF, CSV, and Excel formats.

Implementation Process

Phased Deployment Approach

The implementation followed a structured methodology developed by Embedos Engineering:

  1. Hardware Installation: Setting up the Embedos Edge devices, sensors, and control mechanisms according to detailed electrical wiring diagrams.
  2. System Configuration:
    • Mapping analog inputs to required ranges through the Embedos configuration interface.
    • Configuring network settings for connectivity.
    • Setting up real-time clock parameters.
  3. Software Setup:
    • Installation of the Embedos control application accessible via port 3001.
    • User authentication system implementation.
    • Dashboard and reporting interface configuration.
  4. Testing Protocol Development:
    • Creating standardized testing sequences.
    • Establishing pass/fail criteria.
    • Implementing safety measures including emergency stops and collision protection.
  5. User Training:
    • Hands-on training for operators and maintenance personnel.
    • Documentation and reference materials development.

Results

Transformative Operational Improvements

The implementation of the Embedos ACV Testing Automation System delivered substantial benefits:

Efficiency Gains

  • Testing Time Reduction: Standardized testing cycles significantly decreased the time required per valve.
  • Automated Documentation: Elimination of manual record-keeping freed up valuable technician time.

Quality Improvements

  • Consistent Test Parameters: Standardized testing conditions across all valve types.
  • Enhanced Leak Detection: Precise pressure measurements at four distinct positions improved defect identification.
  • Data-Driven Quality Control: Comprehensive test reports facilitated trend analysis and quality improvements.

Operational Benefits

  • Dual Mode Functionality: Production and maintenance modes provided operational flexibility.
  • Remote Monitoring Capabilities: Embedos network connectivity enabled off-site supervision and analysis.
  • Historical Data Analysis: Archived test results supported continuous improvement initiatives.

Key Features and Innovations

Advanced Testing Capabilities of the Embedos Solution

The system incorporated several innovative elements:

Multi-Position Testing

The Embedos solution enabled thorough testing at four critical valve positions:

  • Neutral (Initial) Position
  • PTO Position
  • Tipping Position
  • Lowering Position

Intelligent Test Sequencing

Automated progression through test phases with built-in safety protocols to prevent equipment damage.

Customizable Parameters

Adjustable settings allowed for optimization across different valve models and testing requirements.

Comprehensive Data Visualization

Embedos Engineering’s real-time displays of:

  • Live sensor values
  • Test duration
  • Pressure differentials
  • Pass/fail status indicators

Integration with External Systems

The Embedos ACV Testing Automation System seamlessly integrates with separate systems, functioning as the central control unit for orchestrating and monitoring the entire testing process. This integration enhances the overall automation capabilities and ensures smooth operation across different system components.

Future Directions

Pathway to Further Enhancement

The successful implementation has opened opportunities for additional improvements with Embedos Engineering:

  1. Integration with Manufacturing Execution Systems: Connecting the Embedos testing platform with broader production management systems.
  2. Predictive Analytics: Applying machine learning to test data to predict valve performance and potential failures.
  3. Remote Troubleshooting Capabilities: Enhanced Embedos connectivity features to allow expert intervention from offsite locations.
  4. Expanded Test Parameters: Additional sensing capabilities to measure temperature, flow rates, and other variables.

Conclusion

The Embedos ACV Testing Automation System represents a significant advancement in hydraulic component quality assurance.

By replacing manual testing procedures with Embedos Engineering’s automation solution, the client has achieved remarkable improvements in testing precision, operational efficiency, & data management.

This case study demonstrates how Embedos Engineering’s targeted technological intervention in specialized manufacturing processes can yield substantial benefits in product quality, operational efficiency, and competitive advantage. The solution not only addressed immediate testing challenges but established a foundation for continuous improvement and further technological integration in the Industry 4.0 landscape.

For more information about Embedos Engineering’s solutions, visit www.embedos.io or contact info@embedos.io.

Grab Your Copy Of The Case Study, Now!

Air Control Valve Testing _ Main Screen

Application Config Screen: Air Control Valve Testing

Certificates Download Screen: Air Control Valve Testing

Report Config Screen: Air Control Valve Testing

Looking for End to End Industrial Automation & IoT Solutions? 


Our Experts Want to speak to You!

Explore Other Case Studies

Embedos_Em Ramanujan (ER) _ Front_1

Hydro Static Testing Data Logger| Hardware & Software

Hydrostatic Testing Automation Using Industrial Data Logger & Real-Time Pressure Analytics, Reports & Pump Control!

The pump behaves as an actuated endpoint within a software-defined test cycle, driven entirely by real-time pressure acquisition and deterministic control logic.

Embedos Architecture for Steel Manufacturer for Nuclear Power Plant

IoT based Industrial Conveyor Belt Monitoring System

The Embedos monitoring system has transformed this maintenance strategy from reactive to proactive, particularly for critical conveyor belt systems essential to nuclear power plant production.

Air Control Valve Testing Through Automation. Embedos Case Study SS 1

Revolutionizing Air Control Valve Testing Through Automation. An Embedos Case Study

The Embedos ACV Testing Automation System represents a significant advancement in hydraulic component quality assurance.

EE+EM _ Use case for HUL _ Embedos

IoT-Based Washing Machine Testing: FMCG Performance Monitoring Case Study

Optimize your washing machine testing with IoT monitoring solutions that track water usage, RPM, temperature, and power consumption.

This case study showcases implementation of real-time data collection and comprehensive performance analysis for quality control and efficiency improvements.”

Vertical Tank Monitoring - Embedos - Em Bose ( EB ) 3.2″ HMI

Industrial Tank Level Monitoring with IoT

1) The Embedos EB Series ( EM Bose ) calcuates the volume of the liquid in the tank & displays its level. The calculation is done based on the inputs from a Pressure sensor that is mounted at the bottom of the tank.

2) The device displays real time values & level of the tank with a view of set points or Threshold Limits between which the liquid of interest should remain.

3) If the Liquid crosses either of the two setpoints, the device sets of a relay which is connected to a high wattage Industrial Lamp ( Bulb ) to indicate that the threshold has been crossed. Also, the device has a buzzer that goes off on the crossing.

Embedos Maxwel - EM - Modbus / CAN bus / IO Expander

Embedos IO Data Logger + 4G Gateway

The Embedos IO data logger is designed to log data to device as analog inputs, a pulse input which is to be converted to RPM value. The logger is able to also display real-time data on a webpage based utility.

The user can interact with the data-logger to configure and view all the settings and device parameters currently running on the device. The logger can store real-time data and send the same data via MQTT to a broker.

Embedo Em Dian – ( ED ) Enclosure

Dual Channel Analog Data Logger + 7” HMI

Deployment Type: Data Logger +7 Inch HMI Display

“Embedos Engineering – 7 inch Data logger HMI, Model ERA021. (Simultaneous 2 channels)

It has 7 inch touch screen display to monitor sensor data graphically. It has options to start and stop data logging facility.

(External Start Stop for each channel via DI) Has USB port for pen drive connection. You can download the data log in excel format for selected date and time. 2 nos. Digital outputs for set point. – Just NPN outputs.

Embedos_CAN based Forklift Reach Height Controller Display - main page

Can Forklift Controller – Reach Height Display

Deployment Year: 2018

Deployment Type: Data Logger + Display

Problem Statement: In narrow warehouses with high racks, the view and space to maneuver are often restricted.

The Embedos Forklift controller and display based on CAN Bus helps the driver with appropriate displays and assistance systems. This makes load handling safer and more efficient.

Embedos_CAN - J1939 Datalogging Dashboard showing decoded parameters in varied widgets

CAN-J1939 Data Logger & Modbus – TCP Gateway

This was deployed in 2021, to log a particular set of parameters from a Caterpillar Engine ECU and display logged data.

The Embedos Monitoring Software was used to visualize logged data from the ECU in the form of charts and gauges, display log files in .csv formats and give options & download all log files into the system

Embedos_Connection Diagram between Datalogger & Expansion Unit

Real Time Data Logger with Embedded Web App

Embedos Data Logger + Embedos Expansion IO Card take in an RS-485 input and  4 Analog Inputs Each to display Guages for 8 Analog Channels. Similarly displays a graph of the last 100 values of corresponding channels.

The Embedos Real Time software running on an Embedded Web Server on the master Data logger allows you to download data shown on the table in Excel, CSV or PDF formats directly.

Embedos_EDGE

Edge_Glove Test Controller

Deployment Year: 2019 – 2022

Deployment Type: Multiple IO Data Logger + Browser based Web App.

The EDGE as a GLT controller provides an internal Modbus Server to read the analog and Digital inputs and control digital outputs.

EDGE calibration, test and network configuration options have been added to the latest iteration of this application of the EDGE.

EmView-Vibration Monitoring Software - Spindle 1

Vibration Monitoring Software

The monitoring software stores historical data of each of the vibration units connected to it.

You can view this data in graphical form by right clicking on a card and selecting View History (Alternately, you can also Double Click on a card to open Graph window)

What is the CAN Bus? – The Ultimate Beginner’s Guide

The Language of Machines: A CAN Bus Journey

The Silent Symphony

Dawn broke over the city as Maya stepped out of her apartment building. The streets were quiet, save for the occasional hum of a passing car. She checked her watch; 6:30 AM. Perfect timing. Her friend Ethan would be arriving any minute for their road trip.

“Right on schedule,” Maya thought as Ethan’s silver sedan pulled up to the curb. She tossed her backpack into the trunk and slid into the passenger seat.

“Morning, Professor,” she teased, knowing how much Ethan loved explaining the inner workings of cars to anyone who would listen.

“Morning, Maya,” Ethan grinned, tapping the dashboard affectionately. “Ready for a little adventure?”

As they pulled away from the curb, Maya noticed the dashboard light up with colorful displays navigation, climate control, engine status, all working in perfect harmony.

“It’s amazing how everything just… works together,” she mused, gesturing at the dashboard. “How does your car know to do all these things at once?”

Ethan’s eyes lit up. There was nothing he loved more than a chance to explain automotive technology.

“That, my friend, is the magic of CAN Bus.

The Birth of a Language

“CAN what now?” Maya raised an eyebrow.

Controller Area Network Bus, Ethan replied, guiding the car onto the highway. “It’s like… imagine if all the systems in this car needed to talk to each other, but they all spoke different languages.”

“Sounds chaotic,” Maya laughed.

“Exactly! Back in the day, that’s exactly how it was. Each system – the engine, brakes, airbags – they all had their own wiring and couldn’t easily communicate. It was a mess of wires and complexity.”

Maya glanced at the sleek interior of the modern car. “Obviously, that’s changed.”

“In 1986, a company called Bosch changed everything,” Ethan continued, his voice taking on the quality of a storyteller. “They created CAN Bus,  essentially a universal language and communication highway for all electronic components in a vehicle.”

As they drove, Ethan told Maya how before CAN Bus, cars were simple creatures with basic needs. A few wires, an engine, and mechanical parts were all they required. But progress demanded more sophisticated engines, safety systems, entertainment features and with this complexity came a problem: communication.

“Think about it like this,” Ethan said as they stopped at a red light. “Imagine if every person in a city could only talk to one other person through a dedicated phone line. You’d need millions of phone lines crisscrossing everywhere!“

“That sounds inefficient and messy,” Maya replied.

“Exactly! That’s what car wiring was like before CAN Bus. But CAN Bus is like giving everyone in that city access to a group chat. Now, every system can communicate over the same network, sharing one communication line. One wire replaced hundreds.”

The Highway of Data

As they merged onto the interstate, traffic began to pick up. Cars jockeyed for position, some speeding ahead while others maintained their pace in adjacent lanes.

“See this highway?” Ethan gestured through the windshield. “This is exactly how the ‘Bus’ in CAN Bus works.”

Maya watched the ebb and flow of traffic with new interest.

“The ‘Bus’ is just a communication pathway,” Ethan explained. “Like this highway, it allows multiple ‘vehicles’ of data to travel together. Some messages are more important than others – they’re like ambulances with sirens blaring, getting priority over regular traffic.”

“So when you hit the brakes…” Maya began.

“Exactly!” Ethan’s face lit up. “When I press the brake pedal, a high-priority message rushes down the CAN Bus highway, telling multiple systems: ‘Hey! We’re stopping!’ The brake lights receive the message and illuminate. The anti-lock brake system activates if needed. The engine adjusts its power. All these conversations happen in milliseconds over a single pathway.”

Maya watched as Ethan changed lanes smoothly, the car responding to his commands instantly. “It’s like an orchestra,” she mused.

“The perfect metaphor,” Ethan nodded appreciatively. “CAN Bus is the conductor, ensuring every instrument plays exactly when it should.”

When Messages Matter Most

About an hour into their journey, a truck ahead of them suddenly slowed. Ethan had been explaining the finer points of error correction in CAN Bus communication when his car’s collision warning system beeped sharply.

The car responded instantly – reducing speed, tightening seatbelts, and preparing the brake assist system – all before Ethan had fully registered the danger.

“That,” he said after they had safely changed lanes, “was CAN Bus in action when it matters most.”

Maya looked impressed. “All those systems reacted at once.”

“And in the right order,” Ethan added. “That’s the beauty of the priority system. The most critical safety messages get through first. If two systems try to send messages simultaneously, the one with the highest priority – usually safety-related – gets through first.”

“What if there’s an error in the message?” Maya asked, intrigued now.

“CAN Bus has that covered too. It’s like sending a text message with a built-in spell checker. If a message gets corrupted during transmission, the system detects it and requests a retransmission. For critical systems, that can happen multiple times per second.”

The Birth of a Revolution

As they stopped for coffee at a roadside diner, Ethan continued his story, telling Maya about the origins of this revolutionary technology.

“Picture this: It’s the early 1980s. Engineers at Bosch are struggling with the growing complexity of vehicle electronics. They need a solution that’s efficient, reliable, and flexible.”

Maya sipped her coffee, genuinely interested now. “So they created CAN Bus?”

“They did. The development started in 1983, and by 1986, they presented it at the Society of Automotive Engineers (SAE) conference. It was revolutionary – a communication protocol specifically designed for vehicles where reliability is literally a matter of life and death.”

“When did it become the standard?” Maya asked.

“It took time,” Ethan replied. “The first CAN controller chips were released in 1991 by Intel and Philips. By 1993, it became an international standard – ISO 11898. Then in 1996, it became mandatory for OBD-II diagnostic systems in all vehicles sold in the United States.”

“So every car on the road uses this now?”

“Most modern ones do. And not just cars , it’s used in factory equipment, medical devices, even some spacecrafts! What started as a solution for automotive complexity became a universal language for all kinds of machines.”

Beyond the Road

Back on the highway, their conversation drifted to other applications of CAN Bus technology. Ethan explained how the same principles that keep cars safe are now being applied in surprising places.

“Those wind turbines we passed earlier? Many use CAN Bus to coordinate blade pitch and monitor performance. The farm equipment in those fields? CAN Bus helps coordinate harvesting operations.”

“What about new technologies like electric vehicles?” Maya asked.

“Even more critical there,” Ethan replied enthusiastically. “In EVs, CAN Bus manages battery systems, monitors charging, and coordinates power distribution. It’s the nervous system that makes electric mobility possible.”

As they approached their destination in the late afternoon, Maya looked at the dashboard with new appreciation.

“I never realized there was this whole conversation happening inside the car,” she said. “It’s like discovering there’s a hidden orchestra playing all around you.”

Ethan smiled. “That’s what I love about technology like CAN Bus. It’s invisible, humble even – working silently in the background. But without it, none of our modern transportation would be possible.”

The sun began to set as they pulled into the hotel parking lot, casting long shadows across the asphalt.

“Is that the end of the CAN Bus story?” Maya asked as they unloaded their luggage.

Ethan laughed. “Not even close. With autonomous vehicles, smart cities, and connected transportation, we’re just beginning a new chapter. The language of machines will keep evolving, but CAN Bus laid the foundation – creating a world where our vehicles are no longer just collections of parts, but orchestrated symphonies of technology.”

“All because someone needed to solve a wiring problem,” Maya mused.

“Sometimes,” Ethan replied, “the most revolutionary ideas start by solving the simplest problems.“

As they walked toward the hotel entrance, the car’s lights flashed once, a symphony of systems saying goodnight, speaking in the silent language of CAN Bus.

CAN_Logo _ Embedos

Technical Specifications: CAN Bus in Detail

What is CAN Bus?

Controller Area Network (CAN) Bus) is a robust vehicle bus standard designed to allow microcontrollers and devices to communicate with each other within a vehicle without a host computer. CAN is a message-based protocol, designed specifically for automotive applications but now also used in other areas such as industrial automation, medical equipment, and building automation.

Core Features of CAN Bus

1. Multi-Master Communication System.

  • Any node can initiate communication when the bus is free.
  • No central controller or host required.
  • Decentralized system architecture.

2. Message-Based Protocol

  • Information is transmitted in messages (frames / packets) of up to 8 bytes.
  • Each message has a unique identifier that determines its priority.
  • Messages are broadcast to all nodes on the network.

3. Priority-Based Arbitration

  • Non-destructive bitwise arbitration.
  • Lower identifier values have higher priority.
  • Ensures critical messages get through first.

4. Robust Error Detection and Handling

Error detection mechanisms:

  • Bit monitoring.
  • Bit stuffing.
  • Frame check.
  • Acknowledgment check.
  • Cyclic Redundancy Check (CRC)
  • Error confinement with fault isolation.
  • Automatic retransmission of corrupted messages.

5. Efficient Data Transfer

  • High-speed transmission (up to 1 Mbps in standard implementations)
  • Short message format reduces overhead.
  • Deterministic conflict resolution.

Origins and Development Timeline

1983

  1. Development of CAN protocol initiated by Robert Bosch GmbH.
  2. Led by Uwe Kiencke, the primary goal was to reduce wiring complexity in Mercedes-Benz vehicles.

1986

  1. First public introduction at the Society of Automotive Engineers (SAE) conference.
  2. Initial specifications published by Bosch.

1987

First CAN controller chips (Intel 82526) announced.

1991

Intel and Philips release the first CAN controller chips to the market.

1993

  1. CAN standardized internationally as ISO 11898.
  2. Defined physical and data link layers of the OSI model.

1995

CAN in Automation CiA established as an international users and manufacturers group.

1996

  1. [OBD-II] (On-Board Diagnostics) with CAN becomes mandatory for all vehicles sold in the USA.
  2. Bosch publishes CAN specification 2.0, defining both standard and extended frame formats.

2000s

  1. Widespread adoption across multiple industries around the world.
  2. Development of higher-layer protocols (CANopen, DeviceNet, J1939)

2012

Introduction of CAN FD (Flexible Data Rate) with increased data payload and higher speed.

2020s

  1. Integration with automotive ethernet networks.
  2. CAN XL development for next-generation vehicles.

For more in depth details on CAN Bus Specifications, Wiring, Voltages, REsistance, Protocols & A Thorough Deep Dive, head to the next article.

Story Continues…

Two weeks after their road trip, Maya called Ethan in a panic.

“I’m drowning in CAN Bus logs trying to debug this system!”

“Still doing it the hard way?” Ethan asked, smiling on his end of the line.

The next day, he showed up at her office with his laptop and shiny cool blue device. “Remember our conversation about the CAN Bus orchestra? Meet the conductor.”

He opened the Em CAN Lens built by Embedos, and Maya watched as incomprehensible data transformed into elegant visualizations. Color-coded message patterns emerged, timing issues became obvious, and the elusive bug she’d been chasing for days appeared in no time.

“This is…” Maya stared in amazement, “like having x-ray vision for CAN networks.“

As they found and fixed the issue together, Maya remembered Ethan’s words: “Sometimes the most revolutionary ideas start by solving the simplest problems.“

For her team, CAN Lens had become that revolutionary idea, turning the hidden language of machines into a visual symphony anyone could understand.


Discover the Em CAN Lens and see your CAN Bus data clearly. Unleash your debugging superpowers with Embedos.

Learn More About the Embedos CAN Lens

Discover how CAN Lens can help you analyze and monitor CAN bus systems in real-time, providing enhanced diagnostics, performance tracking, and actionable insights.

Our Experts Want to speak to You!

Your goals are of utmost importance to us

Frequently Asked Questions

What does CAN Bus stand for?

CAN Bus stands for Controller Area Network, a communication system used in vehicles and industrial applications.

Why was CAN Bus developed?

CAN Bus was developed by Robert Bosch Gmbh in 1986 to simplify the wiring in vehicles, reduce costs, and ensure reliable communication between electronic systems.

How does CAN Bus ensure data accuracy?

CAN Bus uses built-in error detection mechanisms to identify and correct transmission errors, ensuring only accurate data is processed.

Is CAN Bus only used in vehicles?

Primarily meant for Electronic Control Units only inside Vehicles. CAN Bus is also used in aerospace, industrial automation, marine systems, and healthcare for reliable data communication.

Can CAN Bus be upgraded or expanded?

Yes. New nodes can be added to the CAN Bus network without major changes, making it highly scalable.

What industries benefit most from CAN Bus?

Automotive, aerospace, healthcare, industrial automation, and marine engineering are the main industries benefiting from CAN Bus.

How fast can CAN Bus transmit data?

CAN Bus supports data transmission speeds of up to 2 Mbps. Some physical layers also allow CAN Bus data rates upto 5 Mbps.

Read More

When a timezone setting becomes a root shell: Four OT edge lessons in Cyber Security to learn in Industrial Automation

Four OT edge lessons from October 2026 CISA ICS advisories: timezone-to-shell, localhost bypass, Linux runtimes on controllers, and pollers without peer identity checks.

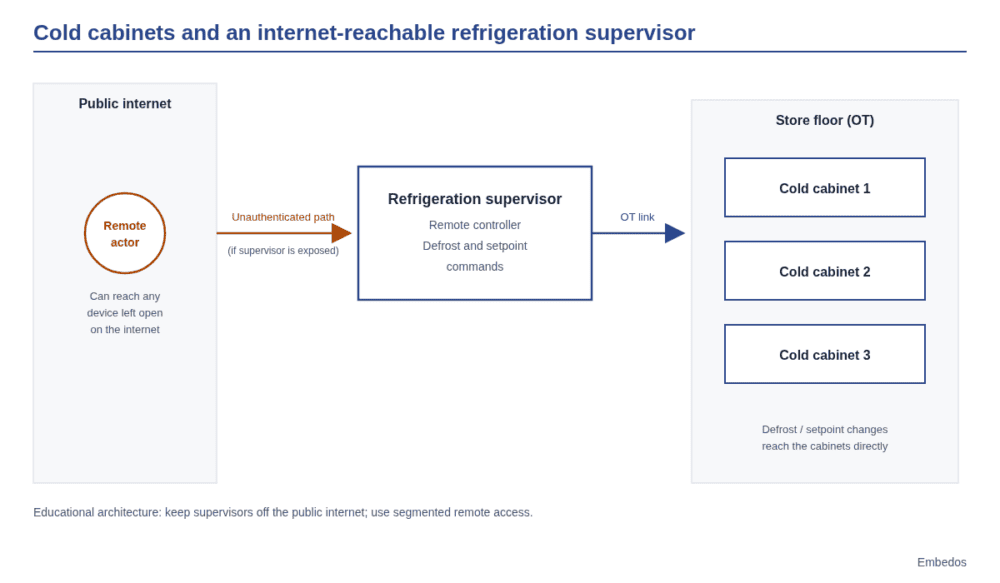
Embedos embedos-blogs diagram of supermarket cold cabinets controlled by an internet-exposed refrigeration supervisor.

When the fridge became the attack surface: France and Germany supermarket cyber lessons (2021 to 2026)

France and Germany supermarket refrigeration OT attacks in 2026, plus CERT-FR and BSI steps operators can take. Cold-chain lessons for India.

Vibration Transmitter 4-20mA 0-25 mm/s: Buyer Guide

Choosing a 0-25 mm/s 4-20 mA vibration transmitter for motors and fans: range, RMS velocity, frequency band, mounting and alarm limits.

Flow Meter Pulse Output vs 4-20mA: Which to Use and When

Pulse output or 4-20mA for your flow meter? Compare totalising accuracy, cable length, noise and PLC input needs, with simple examples for Indian plants.

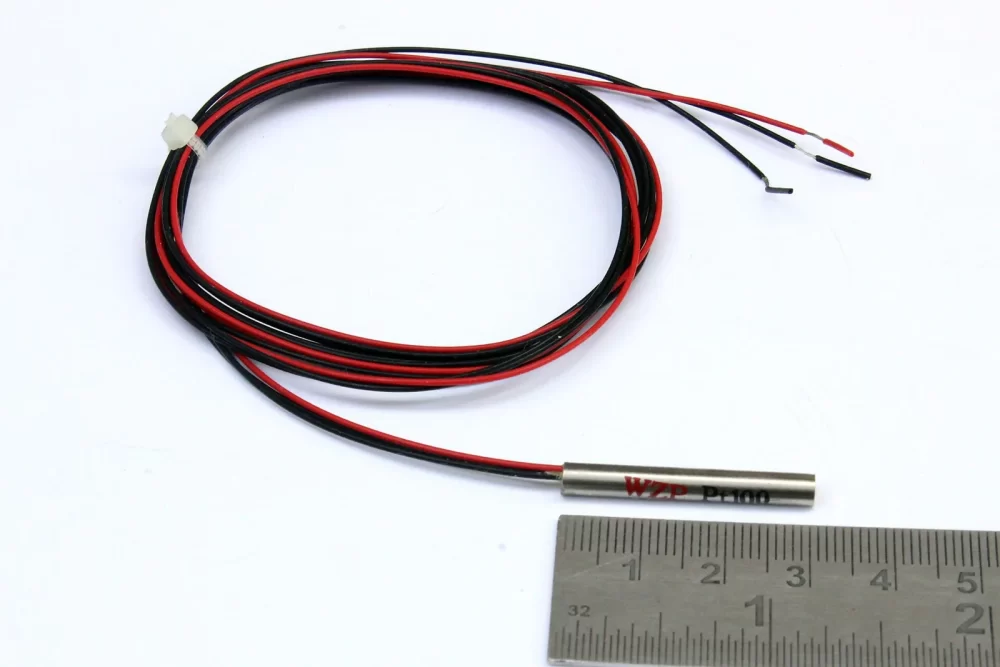
embedos-blogs-3-wire-pt100-to-4-20ma-transmitter-embedos-rtd: 3 wire PT100 sensor showing the three lead wires used for lead compensation

PT100 to 4-20mA Transmitter or Direct RTD Input?

PT100 for remote monitoring: wire it direct as 2, 3 or 4 wire RTD, or add a head mounted 4-20mA transmitter? Cable length, accuracy, noise and cost compared.

4G vs 5G Industrial Router: Which Suits Your Plant in India

4G or 5G industrial router for PLC and SCADA telemetry? Compare coverage, bandwidth, power, cost and dual SIM failover for Indian plants before you buy.

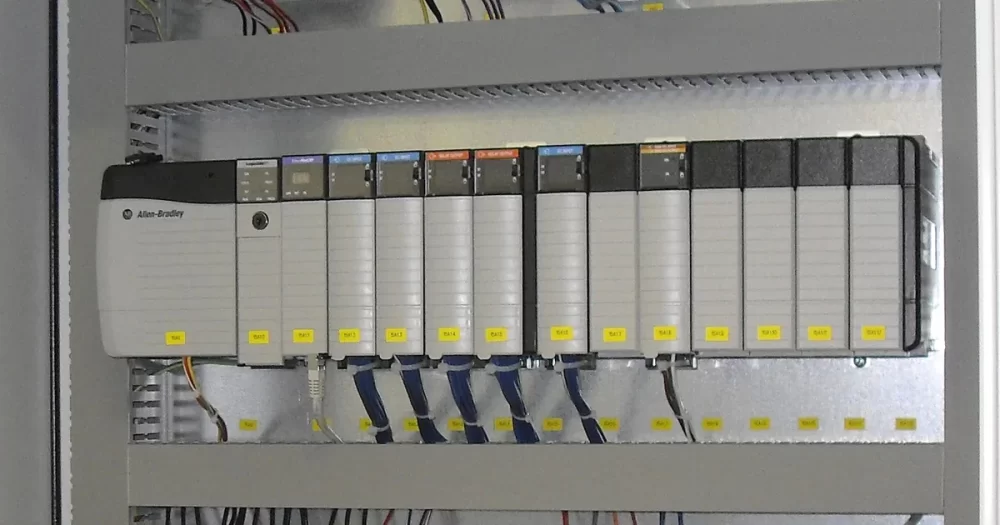
Embedos blogs embedos-blogs: PLC I/O rack wired in an industrial control panel, featured image for the Embedos guide to reading a Modbus register map

Modbus Register Map: How Do You Read It and Decode 32-bit Values (ABCD, CDAB, BADC, DCBA)?

How to read a Modbus register map: function codes, 40001 vs 0-based addresses, data types, scaling and a 32-bit float decoded. | Embedos Mumbai

embedos-blogs-din-rail-4-20ma-signal-isolator-ground-loop-embedos-panel: DIN rail clamp terminal block, the kind of panel where a 4-20mA signal isolator is fitted before a PLC or gateway

4-20mA Signal Isolator: When You Need One for Ground Loops

When does a 4-20mA or 0-10V loop need a signal isolator before a PLC or IoT gateway?

Ground loops, shared supplies, noise signs and isolator types.

Embedos blogs featured image with the title Modbus RTU vs Modbus TCP: Frames, Wiring, Speed and When to Use Each, beside two rows of byte cells with the shared PDU shaded.

Modbus RTU vs Modbus TCP: Frames, Wiring, Speed and When to Use Each

Modbus RTU vs Modbus TCP from the official specs: framing, CRC vs MBAP header, addressing, port 502, RTU over TCP and gateways, for plant engineers.

Embedos blogs featured image with the title How to Build an OEE Baseline in Indian Plants Before You Buy an MES, beside stacked bars that shrink from shift time to fully productive time.

How to Build an OEE Baseline in Indian Plants Before You Buy an MES

Set a defensible OEE baseline before you choose MES software: what to measure, for how long, and how Indian plants can start with the machines they have.

Embedos blogs embedos-blogs: third-party sound level meter analogue 4-20 mA or 0-10 V into Embedos Edge then EmView

How do you keep proving data center noise compliance after the site is built?

After a data center is built, one survey is not enough. How to run continuous boundary noise compliance logging against CPCB day and night limits in India.

Digitise a Bursting Strength Tester: Peak Hold to Wi-Fi Log

Upgrade a manual bursting strength tester with peak hold, auto bursting factor, RS-485 printer output and Wi-Fi data logging, without a new machine.

Embedos blogs featured image with the title Retrofitting Legacy Machines and PLCs with OPC UA or Modbus, beside four machine boxes A to D connected to an edge device and a plant system.

Retrofitting Legacy Machines and PLCs with OPC UA or Modbus

How to connect legacy machines and old PLCs without touching control logic: when Modbus is enough, when OPC UA pays off, and a read-only first retrofit.

Embedos blogs featured image with the title Measuring and Monitoring Data Center Noise Against Indian Limits, beside a sound level meter icon and a 24 hour noise trace with the night band from 22:00 to 06:00.

Data Center Noise Monitoring: Measure Against Indian Limits

How to measure and continuously monitor data center noise against CPCB day and night limits, Class 1 meters, Leq/L90/spectra and logging via a third-party meter into Embedos Edge.

Embedos blogs photo of a narrow aisle between rows of server racks in a server room, where staff work beside continuous fan noise.

Data Center Noise Levels Inside: Protect Staff Hearing

Measure inside data center noise levels, compare them with Indian and NIOSH exposure limits, and protect data hall staff with a hearing plan that works.

CAN Bus for blog_Embedos

What is the CAN Bus? – The Ultimate Beginner’s Guide

What is CAN Bus?

Controller Area Network (CAN) Bus) is a robust vehicle bus standard designed to allow microcontrollers and devices to communicate with each other within a vehicle without a host computer.

CAN is a message-based protocol, designed specifically for automotive applications but now also used in other areas such as industrial automation, medical equipment, and building automation.

Embedos Cloud _6

Public, Private & Hybrid Cloud Types! Also Community Cloud!

Public, private, and hybrid clouds each have their own set of advantages and disadvantages, and the choice of which one to use depends on the specific needs of the organization.

Public clouds offer scalability and cost-effectiveness, while private clouds offer control and security.

Hybrid clouds offer the best of both worlds.

It is important for organizations to evaluate their specific needs and choose the type of cloud that best meets their requirements.

Embedos Cloud Compliance _1

How for organizations – it is cloud compliance that creates value and trust in security.

Cloud computing can deliver tremendous amounts of business value to organizations, but it requires a strategic approach and a willingness to embrace change. Organizations that are able to do this, can reap the benefits of cloud computing and gain a competitive advantage in the marketplace.

Today, almost every manufacturing customer that is digitally transforming becomes partly a software company.

This is because digital transformation in manufacturing involves the integration of advanced technologies such as software, cloud services, data analytics, and artificial intelligence into traditional manufacturing operations.

These technologies enable manufacturers to improve efficiency, increase productivity, and gain insights from data to make better decisions.

By incorporating software into their operations, manufacturers can automate and streamline processes, improve communication and collaboration within the organization, and gain access to advanced analytics tools to make data-driven decisions.

Embedos_Cloud_Smart_Factory

Why manufacturers don’t like cloud computing!

Manufacturers who have not yet adopted cloud computing may be hesitant to do so for a variety of reasons. Some of the most common reasons include:

1) Familiarity with traditional methods: Long-standing businesses may be reluctant to move away from the familiar ways of working that have been successful for them in the past.

Embedos_System on Module _ 4

System on Module ( SOM ) vs System on Chip ( SOC ) – Which is better ?

Hence, SOM vs SOC which is better?

Whether a System-on-Module (SOM) or a System-on-Chip (SoC) is better depends on the specific requirements and constraints of your project. Both have their own advantages and disadvantages and the choice between the two will depend on the specific needs of your application.