When the fridge became the attack surface: France and Germany supermarket cyber lessons (2021 to 2026)

On the night of 11 to 12 October 2026, someone logged into the refrigeration supervisors of hundreds of French supermarkets and told the cold cabinets to defrost. Thierry Cotillard, CEO of the Mousquetaires group (Intermarché, Netto), said the attackers managed to put  “all our cold cabinets into defrost and raise them to as much as 50 °C”,  as quoted by franceinfo.

There was no ransom note. As of 13 October the attack had not been claimed. Nobody encrypted a file server. The target was the operational technology (OT) that keeps fresh and frozen stock cold: remote supervisors sitting on the internet, reachable by anyone who found them.

The French national CERT published alert CERTFR-2026-ALE-012 the same day. It names the affected product families: Danfoss AK-SM series, Danfoss AK-SC series, Copeland xweb and Dixell xweb. Three weeks later, a store in Bavaria saw the same thing happen to its cooling.

This post walks through what is confirmed, how the pattern changed over five years, and the steps CERT-FR and the German BSI actually published. Then a short note on why anyone running cold storage in India should read this carefully.
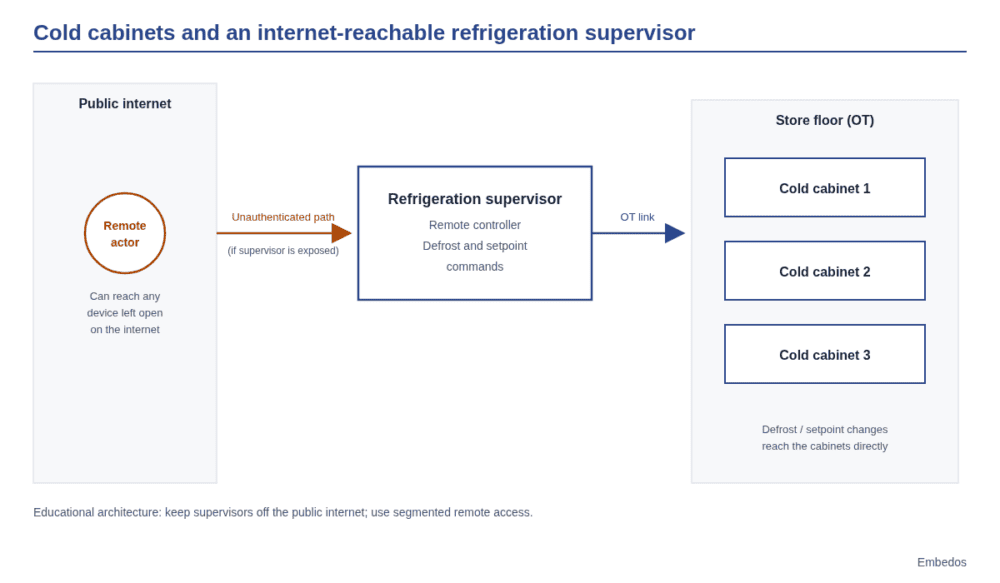
Embedos embedos-blogs diagram of supermarket cold cabinets controlled by an internet-exposed refrigeration supervisor.

What happened in France in October 2026

The CERT-FR alert is titled “Incident de sécurité ciblant les contrôleurs à distance des installations de réfrigération” (security incident targeting remote controllers of refrigeration installations). It was first issued on 12 October 2026, updated on 13 October to add more equipment, and updated again on 16 October with revised recommendations.

Retailers confirmed their own impact to the press. As reported by franceinfo on 13 October:

  • Intermarché and Netto: at least 300 stores
  • Coopérative U: fewer than 100 stores
  • E.Leclerc: “several” stores
  • Carrefour: 80 supermarkets
  • Monoprix: about 30 stores

The stated numbers alone add up to more than 400 stores, before counting U and Leclerc. The true national total has not been published by any official source.

Danfoss told franceinfo that “the majority of the devices concerned are obsolete products, notably the AK-SM800 and AK-SC355 systems, which have reached end of life and no longer receive software or security updates.”

The Paris prosecutor opened an investigation, assigned to OFAC, the French police office for cybercrime. Intermarché said its insurers do not cover this type of incident. Store managers quoted in the press gave losses of about €60,000 at Etréchy, €55,000 at Issy-les-Moulineaux and €270,000 across two Intermarché stores in Haguenau. Nobody has published a verified total.

What is not known matters as much. No official source has stated how the attackers got in. You will see claims about default passwords or specific vulnerabilities in commentary; none of them is confirmed by CERT-FR or the vendors, so we leave them out.

Germany: the BSI warning and Reisbach

On 13 October 2026 the BSI, Germany’s federal cyber security agency, issued a press release urging operators of internet-reachable control systems, including food-cooling systems, to secure them. BSI President Claudia Plattner said: “This attack could have hit any country and can find copycats at any time. Such entry points practically invite sabotage.” The BSI published recommendation BSI-CS 154, “Gefährdung durch internet-verbundene OT-Systeme” (threats from internet-connected OT systems), on the same day.

The warning was right. On the night of 1 to 2 November 2026, the Edeka store in Reisbach, Lower Bavaria, confirmed to BR24 that its cooling had been set to “50 Grad Heizen”, 50 degrees heating. Most of the stock was discarded. BR reported that the same wave hit stores in Belgium, Sweden, Ireland, Luxembourg, Estonia and the Netherlands, that no financial demands were made, and that experts suspect sabotage.

How many German stores were hit beyond Reisbach is not confirmed.

Five years of supermarket incidents: from IT to OT

The October wave looks sudden, but it sits at the end of a clear line. Earlier incidents in the same two countries hit IT systems and customer data. 2026 is the year the target became physical.

April 2021: tegut, Germany (cyberattack, IT)

Fulda-based grocer tegut was hit by a cyberattack in April 2021. Under its emergency plan, the company shut down and disconnected all head-office network systems, including the merchandise programmes that control disposition in logistics, as reported by heise. tegut warned of isolated gaps in product availability. Stores stayed open.

tegut refused to negotiate. In its press release relayed by fuldainfo, the company said it would not enter negotiations with criminals. The attackers then published company data on the dark web.

Lesson: a pre-planned isolation procedure kept the shop floor running even with head-office IT down.

October 2022: METRO, Germany, France, Austria (IT outage)

On 17 October 2022, wholesaler METRO suffered a cyberattack that caused a partial IT outage, confirmed in its newsroom. Store teams set up offline systems to process payments, as reported by SecurityWeek, with impact in Germany, France and Austria.

During recovery, METRO found malware again and shut down some systems a second time (newsroom status, 23 November 2022). Its 2021/22 annual report put the earnings hit in the mid-double-digit millions of euros.

Lesson: recovery is not done when systems come back. Reinfection during restoration is a real risk.

November 2024 to August 2025: Picard and Auchan, France (customer data)

In November 2024, Picard reported unauthorised access affecting 45,000 of its 11 million loyalty accounts, said it had not detected an intrusion into its information systems, and notified the CNIL (Le Parisien, quoting Picard).

Auchan disclosed a breach of more than 500,000 loyalty accounts in November 2024, with no bank data or passwords stolen, and notified the CNIL (franceinfo). On 21 August 2025 it disclosed a second loyalty-data breach affecting “several hundred thousand” customers (ICI).

October and November 2026: refrigeration OT

Then the October wave in France and the November Reisbach case in Germany. The difference is direct physical loss: product that has warmed up has to be thrown away, regardless of whether any data left the building.

One note on myths. We found no official confirmation of ransomware at Casino, Carrefour, Leclerc, Système U, Intermarché, Lidl, Aldi, Kaufland or Globus before October 2026. If you read otherwise, check the source.


Reviewing cold-chain OT exposure?

Tell us what you run on site and we will get back to you.

Why the refrigeration supervisor is such an easy target

A store refrigeration supervisor sits between the cabinets and compressor packs on one side and the refrigeration contractor on the other. The contractor wants to see alarms and change setpoints without driving to the store. The easiest way to give them that is a web interface on a public IP.

CERT-FR is blunt about this: “De manière générale l’exposition d’une interface de gestion sur Internet est contraire aux bonnes pratiques.” In general, exposing a management interface on the internet goes against good practice.

Add Danfoss’s own statement that most affected units were end-of-life models without security updates, and the picture is simple. Old supervisors, still in service because they still control the cold room, reachable from anywhere. The device does exactly what it is told, including defrost and heating.

Practical checklist: what CERT-FR and BSI tell operators to do

Everything below comes from CERTFR-2026-ALE-012 or the BSI press release of 13 October 2026 and BSI-CS 154. We have not added steps of our own.

1. Inventory and exposure check

  • List every refrigeration supervisor and controller across your sites, with model and firmware. Pay particular attention to Danfoss AK-SM, Danfoss AK-SC, Copeland xweb and Dixell xweb, the families named by CERT-FR.
  • Check which of these is reachable from the internet. The BSI tells operators to check their exposure.

2. Remove public internet exposure

  • CERT-FR’s first step: remove internet exposure of the affected units, and of any unit on a public IP.
  • BSI: block direct internet access to control systems.

3. Contractor remote access through VPN, with MFA

  • CERT-FR: restore remote access only through a secure VPN or a protected network. Filtering by source IP is acceptable only as a temporary measure.
  • BSI: use VPN and multi-factor authentication.

4. Patch, or replace end-of-life units

  • CERT-FR: update firmware, and for Danfoss units set security to “Strict” mode.
  • BSI: patch promptly.
  • CERT-FR warns that for end-of-life devices a factory reset alone is not enough, because the device stays vulnerable. If the vendor no longer ships security updates, plan the replacement.

5. Change default passwords

  • CERT-FR lists changing default passwords among its recommendations.

6. Review the full configuration, especially defrost windows

  • CERT-FR: check the whole configuration, in particular defrost windows. A compromised unit should be rebooted or factory reset and then reconfigured, keeping the end-of-life warning above in mind.

7. Read your insurance contract before cutting the contractor feed

  • CERT-FR: check your insurance contract terms before cutting the data feed to your refrigeration contractor. Intermarché said its insurers do not cover this type of incident, so check what yours actually say.

Segmentation: three zones, not one network
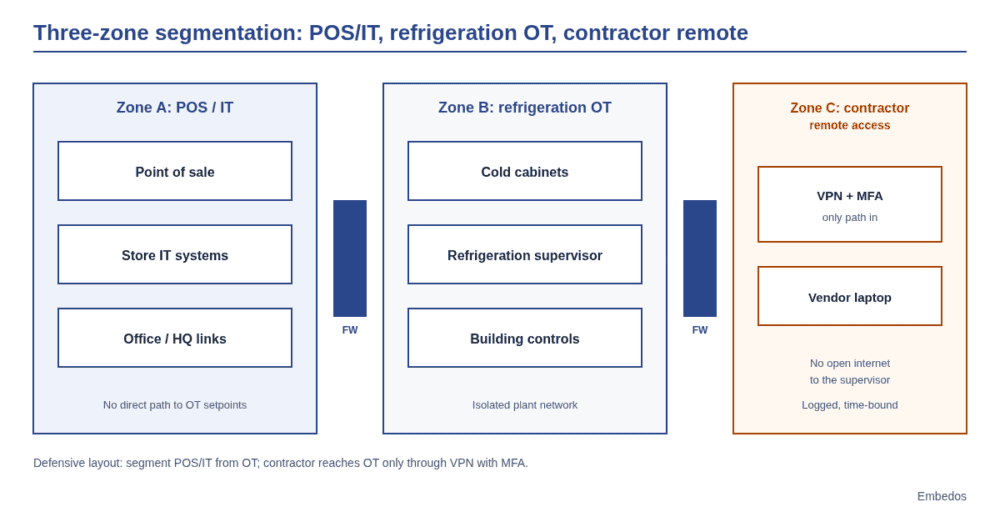
Embedos embedos-blogs three-zone plant diagram POS IT vs refrigeration OT vs contractor remote access.

The incidents above map to three different zones, and each should be treated separately:

Zone What lives there What went wrong in the timeline

A compromise in one zone should not hand over the next. The practical meaning of CERT-FR’s VPN and protected-network advice is that the contractor zone is a controlled entry point, not an open door on a public IP.

What this means for cold chain in India

We are not aware of any Indian incident like this, and we are not claiming one. The principle transfers anyway.

Cold storage warehouses, dairy chilling centres and pharma cold rooms in India increasingly use controllers that a contractor or OEM supervises remotely, often over Modbus to a gateway or supervisor. The pattern from France is the same: a controller that can change setpoints and defrost cycles, a contractor who needs remote access, and a temptation to make that access as easy as a public web page.

The CERT-FR and BSI checklist above applies almost word for word. Know what you have, take management interfaces off the public internet, put contractors behind VPN and MFA, plan the replacement of units that no longer get security updates, change defaults, and know what your insurer covers. For pharma, where a temperature excursion can mean a batch is written off, the defrost and setpoint review in step 6 deserves a regular slot in your maintenance calendar.

Visibility is the part you can add

None of the official guidance replaces the basics above, and monitoring is not a substitute for removing exposure. But in both France and Germany, the damage was a temperature change that someone had to notice. An independent view of cabinet and cold room temperatures, separate from the supervisor that is being instructed, tells you that something changed even when the controller itself has been told otherwise.

That is the kind of work we do with Embedos Edge, our platform of products, solutions, dashboards, insights and services for industrial telemetry. For cold chain, that means temperature and equipment telemetry, dashboards and anomaly alerts that sit alongside your existing refrigeration controls. If you run cold storage, dairy chilling or pharma cold rooms and want to talk through how to get that visibility, get in touch with our team in Mumbai.

Next step. Drop a Mail!

If you run a cold storage, dairy chilling, pharma cold rooms or general wrehouses, and want to talk through independent temperature visibility alongside your existing controls, email the Embedos team.

Email: team@embedos.io

Help Us Help You Leverage The Power Of Industrial Automation & Industrial IoT – IIoT.

Warehouse temperature and humidity monitoring system for agri commodities

A warehouse temperature and humidity monitoring system for agri commodities measures two different things.

Ambient relative humidity (RH) and temperature tell you about the air in the shed;

Grain moisture tells you about the stock.

Mould risk rises when the air between the grains stays above about 70% RH, so log ambient RH and temperature continuously, spot-check or probe the commodity itself, connect remote godowns over 4G, and alert on trends rather than single readings. If you’re searching forr a warehouse moisture monitoring system; this is it.

Anyone who is looking for warehouse operations heads, quality managers and engineers at agriculture warehousing and commodity storage firms, cold storages, logistics units, storage units, running many sheds across India.

embedos-blogs: photo of warehousing godown sheds in Uttar Pradesh, India, where temperature and humidity are monitored for stored commodities

Tell us what you need on site

Need this on your plant? Tell us your requirement

Ambient RH and temperature or grain moisture probes: what is the difference?

Grain and air trade moisture until they reach balance, the equilibrium moisture content (EMC). The Food And Agriculture Orgganisation of the United Nations (FAO) has procedures written for how one can efficiently store.  Guidance on post-harvest losses treats 70% RH as the “safe” level and gives the moisture in equilibrium with 70% RH at 27°C, for example 13.5% for maize and wheat.

FAO’s manual on post-harvest grain losses notes that fungi start growing above 65 to 70% RH.

FAO’s chapter on grain drying and storage adds that for most cereals EMC drops by about 0.5% for every 10°C rise at the same RH, and that grain in sacks can usually be stored 1 to 2% wetter than in bins.

  • Ambient sensors (RH and temperature in the shed air) are cheap, accurate and easy to network. A good digital sensor such as the Sensirion SHT45 is specified at ±1.0% RH and ±0.1°C. They tell you when ventilation will dry or wet the stock, and when the shed is drifting toward risk.
  • In-stack or in-bulk probes measure temperature, RH or moisture inside the stock, where spoilage starts. They cost more per point and need care when stacks are built and moved.
  • Moisture meters on samples remain the reference for each lot at intake and at intervals. FAO’s guidance describes the common measurement methods and their limits.
What is the safe moisture content for grain storage?

FAO gives the moisture in equilibrium with 70% RH at 27°C as the upper limit for safe storage: 13.5% for maize and wheat, with other values for other commodities. For long-term storage, aim lower. Always check the limit your quality contract or standard uses.

How many sensors does a shed need?

There is no single number; it depends on shed size, stack layout, roof heat and ventilation. A practical starting layout:

  • One ambient RH and temperature sensor per ventilation zone, at stack height, away from doors and direct sun.
  • One sensor near the roof on the hottest side, because roof heat drives moisture migration in the stock.
  • One outdoor sensor per site, so you can decide when opening vents will dry the shed rather than wet it.
  • In-stack probes in the stacks with the highest value or the longest planned storage first.

embedos-blogs: photo of a food grain godown building in Kerala, India

Connectivity for remote godowns: why 4G and store-and-forward matter

Agri warehouses are often outside town with no LAN. A gateway on 4G sends readings from each shed, and store-and-forward keeps them during network gaps so the history has no holes.

Check signal inside the shed, not at the gate: metal roofs and walls weaken it, and an external antenna may be needed.

Sensors inside the shed connect to the gateway over RS-485 Modbus RTU (see the Modbus specifications) or as 4-20 mA signals.

How should you set alert thresholds for spoilage?

  • RH trend alert: ambient RH above your limit (for example 70%, from the FAO guidance) for a set number of hours, not for a single reading after a rain shower.
  • Temperature rise in the stack: a probe reading rising while ambient is steady points to biological activity. Alert on the rise over a set period.
  • Ventilation advice: outdoor RH lower than indoor RH means opening vents can help; the reverse means keep them shut.
  • Sensor health: alert when a sensor stops reporting, so a dead sensor is not mistaken for a safe shed.
What humidity is too high in a grain warehouse?

Use about 70% RH as the warning line: FAO treats it as the safe level, and fungi start growing above 65 to 70% RH.

Alert on sustained readings rather than brief peaks, and check the stock itself when the alert fires.

What does a multi-site dashboard show?

A list of sites ranked by risk, then sheds within a site, with current ambient RH and temperature, outdoor RH, stack temperature trends and open alerts.

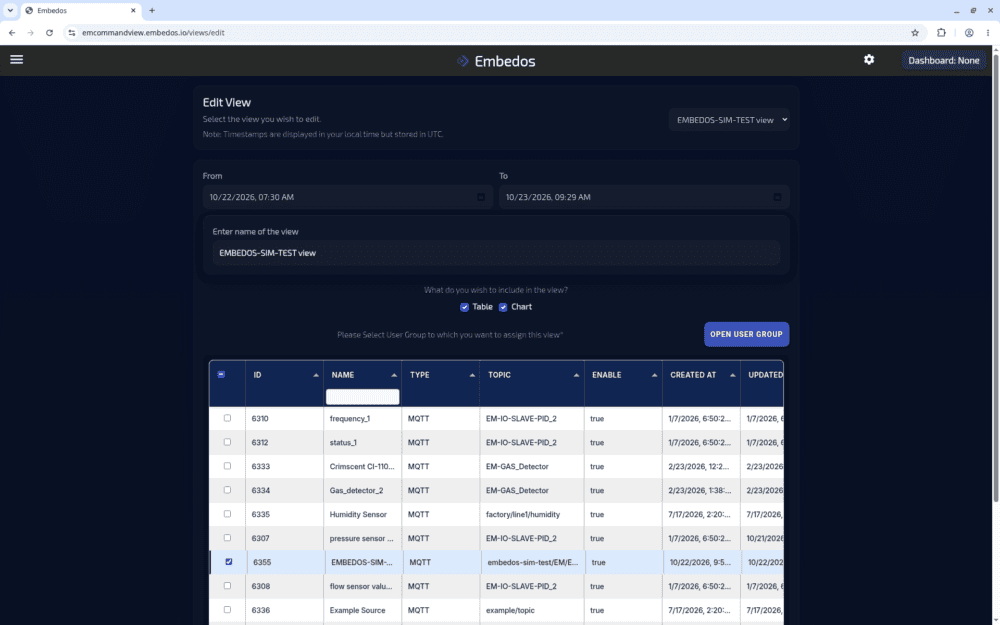
EmView, the Embedos cloud dashboard, provides monitoring, alerts and control views across sites. In EmView, a view groups sources such as humidity and temperature sensors into a table and chart for a set time window.

emview-view-data-sources-embedos-blogs: EmView view settings screen with a time window, table and chart options and the list of MQTT data sources to include

Automation angle: where Embedos Edge fits

Embedos Edge (the platform) reads RH and temperature sensors over RS-485 Modbus RTU or on 4-20 mA and 0-10 V inputs, sends data over GSM 2G/4G, Wi-Fi or Ethernet with MQTT or HTTPS, keeps it through outages with data buffering, and raises SMS and email alerts.

Logic on the device can run trend alerts locally, OTA updates and device health visibility help when sites are hundreds of kilometres apart, and EmView shows all sites in one place. Convert analog sensor outputs with our 4 to 20 mA loop scaling calculator.

Warehouse monitoring setup checklist

  1. List sites, sheds, shed sizes and the commodities stored in each.
  2. Mark ventilation zones, roof hot side and doors on a shed sketch.
  3. Choose ambient sensors and decide where in-stack probes are worth the cost.
  4. Check 4G signal inside each shed and plan antennas.
  5. Agree RH and temperature thresholds per commodity with the quality team.
  6. Decide who gets alerts at each site and who escalates.
  7. Plan sensor calibration checks and record them.
  8. Keep moisture meter readings at intake and at intervals alongside the sensor data.

Can an RH sensor measure grain moisture?

Indirectly. An RH sensor inside the grain mass reads the air in balance with the grain, and that can be converted to moisture using the commodity’s equilibrium curve. The curve varies with variety and temperature, so confirm with a moisture meter.

Do I need a separate sensor outside the warehouse?

Yes, if you want ventilation advice. Comparing outdoor and indoor RH tells you whether opening vents will dry or wet the shed.

Next step! Send us a Mail

Send us the stroke, the resolution and speed you need, how the sensor will be mounted (in a cylinder, on a profile or with a wire), the conditions at the sensor head and the input your PLC accepts.

Email: team@embedos.io

Help Us Help You Leverage The Power Of Industrial Automation & Industrial IoT - IIoT.

Vibration Transmitter 4-20mA 0-25 mm/s: Buyer Guide

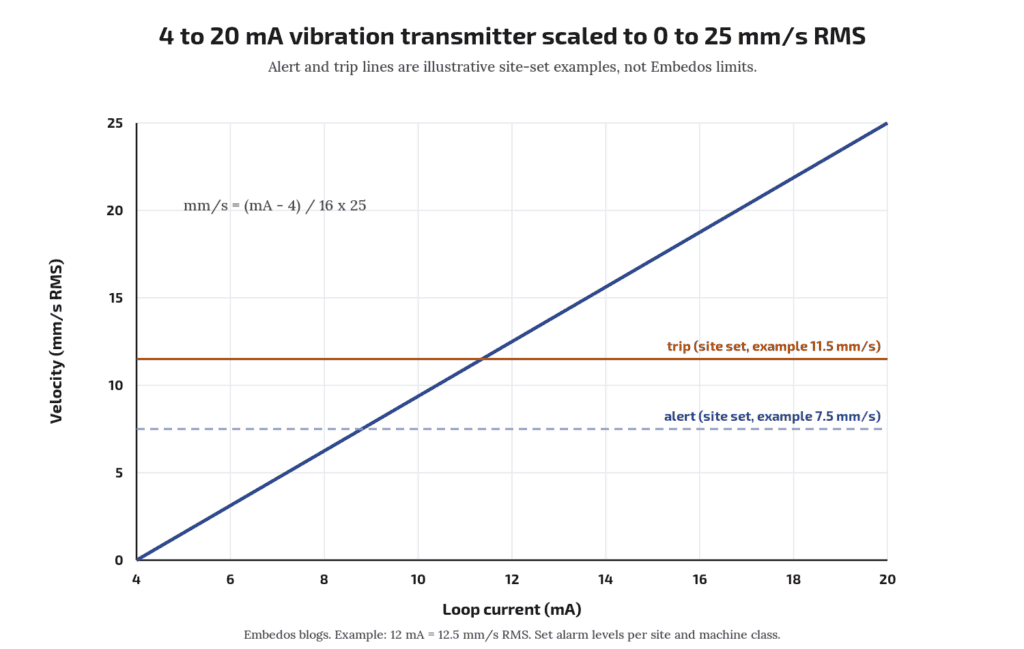
Direct answer: a vibration transmitter 4-20mA 0-25 mm/s gives one number per point: overall RMS vibration velocity on the bearing housing, scaled so 4 mA = 0 mm/s and 20 mA = 25 mm/s.

That range suits most general-purpose motors, fans and pumps, because typical alert and trip levels in the ISO 20816 framework sit well inside 25 mm/s. When buying one, fix five things on the datasheet: measured quantity (RMS velocity), range, frequency band, mounting method, and how you will set alarm limits.

This guide is educational; it does not describe an Embedos product.

Who this is for: maintenance and instrumentation engineers writing a spec or purchase request for loop-powered vibration transmitters on motors, fans, blowers and pumps.

Tell us what you need on site

Need this on your plant? Tell us your requirement

If you have not yet decided between 4-20 mA and RS-485 Modbus, read 4-20mA vs RS485 vibration sensor for motor monitoring first. 

Embedos blogs embedos-blogs diagram: 4 to 20 mA line mapped to 0 to 25 mm/s RMS velocity with example alert and trip lines

What the transmitter measures

The usual trend value for rotating machines is broadband RMS vibration velocity in mm/s, measured on non-rotating parts such as bearing housings. ISO 20816-1 sets out general guidelines for measuring and evaluating machine vibration on these parts (ISO 20816-1). Velocity is used because, over the middle frequency range where imbalance, misalignment and looseness show up, it tracks vibration severity reasonably evenly.

A 4-20 mA transmitter contains an accelerometer, integrates the signal to velocity, filters it to a band, calculates RMS, and drives the loop. The 4 to 20 mA live-zero range is standardised in IEC 60381-1 (IEC webstore).

Check on the datasheet: RMS, not peak or peak-to-peak. Some transmitters offer “peak” velocity or “equivalent peak” (RMS × √2). Mixing them gives a 41% error when you compare against ISO-style limits.

Why 0-25 mm/s is the common range

Two reasons:

  1. Resolution where it matters. On a 0-25 mm/s range, 1 mm/s is 0.64 mA (16 mA ÷ 25). Healthy machines often run at a few mm/s, so a wider range such as 0-50 mm/s halves the current change per mm/s and makes small trends harder to see on a 12-bit input.
  2. Headroom above trip. Set alert and trip levels by evaluating against ISO 20816-3 zone boundaries for the machine group and foundation (ISO 20816-3). A 25 mm/s top leaves room above trip so the signal does not saturate during a fault.

Pick 0-50 mm/s or wider only for machines that run rough by design (some crushers, vibrating screens) where the maker states higher normal levels.

Scaling: velocity = (mA − 4) ÷ 16 × 25. At 8 mA, velocity = 4 ÷ 16 × 25 = 6.25 mm/s. Check your own with the 4-20 mA loop scaling calculator.

What should the input read when the wire breaks?

Below 4 mA, often near 0 mA. Set the receiver to flag a current below the NE 43 failure range (about 3.6 mA on most transmitters; check the manual) as a fault, in line with NAMUR NE 43 (NAMUR). Check whether your transmitter supports NE 43 signalling.

Frequency band

The broadband measurement band depends on machine speed per ISO 20816; read the band for your machine from the relevant part (ISO 20816-1).

Buyer checks:

  • Does the datasheet state the band and does it suit your machine speed per ISO 20816? If not, ask.
  • Slow machines: a fan at 300 rpm runs at 5 Hz. A transmitter whose lower cut-off sits near or above 5 Hz will miss most of its 1× vibration. Choose a transmitter with a lower cut-off well below running speed.
  • Bearing defects: early rolling bearing faults show at higher frequencies and often in acceleration, not velocity. A 0-25 mm/s velocity transmitter is a general health trend, not a bearing diagnostic tool.
Can one 4-20 mA transmitter catch bearing faults early?

Not reliably. It gives overall velocity. For early bearing faults, look at acceleration or envelope values, usually from an RS-485 or portable analyser. See ENQ-007 for the trade-off.

Mounting

Mounting changes the reading more than most spec items.

  • Location: on the bearing housing, close to the load zone, in the direction you want to watch (horizontal on most horizontal machines, since stiffness is usually lowest there).
  • Method: a stud on a spot-faced flat surface gives the best frequency response. Adhesive mounting pads are a common second choice. Magnets are for surveys. Vendor application notes show how the usable upper frequency drops as mounting gets less rigid; check the accelerometer maker’s mounting manual for the response of each method.
  • Thread: confirm thread size (often 1/4-28 UNF or M8) and whether an adaptor is supplied.
  • Cable: armoured or screened twisted pair, screen grounded at one end per your plant practice. On VFD-driven motors keep the run away from motor power cables.
  • Enclosure: state the IP rating needed. Degrees of protection are defined in IEC 60529 (IEC webstore). For hosed-down areas ask for IP66 or IP67 and check the cable gland too.
  • Hazardous areas: if the motor is in a classified zone, you need a certified transmitter and the right barrier. Do not substitute.

Download the Free “Vibration Transmitter 4-20mA 0-25 mm/s Checklist”

Enter your email and the form emails you the copy link to the Google Sheet.


Alarm limits: how to frame them

ISO 20816 evaluates vibration in two ways: absolute magnitude against zones, and change from a known baseline. Use both.

  1. Classify the machine by type, power and foundation (rigid or flexible) as the relevant ISO 20816 part requires.
  2. Read the zone boundaries from that part for your class. Zone A is new machines, B is acceptable for long-term running, C is limited running, D is damaging.
  3. Set alert near the B/C boundary, or at baseline plus an agreed step if the machine normally runs well below it.
  4. Set trip no higher than the C/D boundary, and only if your protection philosophy allows a trip from this signal.
  5. Add a delay of a few seconds to ride through start-up transients.

Alert and trip values are site decisions. Write down which ISO part and table you used so the next engineer can check it.

Should a vibration transmitter trip the motor directly?

Some plants wire it to a PLC trip; others alarm only. Follow your protection philosophy and get it reviewed. Never rely on a polled network value as the only trip path without review.

Spec sheet checklist

Item What to write
Measured quantity RMS velocity, mm/s
Range 0-25 mm/s (state if different, with reason)
Output 4-20 mA, 2-wire loop powered, NE 43 fault signalling if available
Frequency band Per machine speed (ISO 20816); lower cut-off for slow machines
Supply e.g. 24 V DC nominal; check minimum loop voltage with your input load
Mounting Stud, thread size, spot-face required
Enclosure IP rating per IEC 60529; cable entry type
Temperature Ambient and surface temperature of the bearing housing
Approvals Hazardous area certification if needed
Documents Datasheet, calibration certificate, mounting guide

Where the data goes

The 4-20 mA loop lands on a PLC analog input or a gateway. From there it can be trended and alarmed. Embedos has interfaced third-party vibration sensors with Embedos Edge, our platform of products, solutions, dashboards, insights and services.

A vibration monitoring software case records a historical EmView-named desktop deployment that logged spindle vibration over OPC UA; that page is a case note, not the current EmView product definition.

Today, readings can be shown on EmView monitoring screens (sign in at emcommandview.embedos.io). The transmitter itself is chosen from your preferred instrument vendor.

FAQ

Why 0-25 mm/s and not 0-50 mm/s?

Better resolution at normal running levels, while still above typical trip levels for general machines. Use wider ranges only where the maker states higher normal vibration.

RMS or peak velocity?

RMS, to compare against ISO 20816 framing. Peak is about 1.41 × RMS for a pure sine.

What frequency band do I need?

The band depends on machine speed per ISO 20816; slow machines need a lower cut-off. Confirm against the ISO part you use.

Stud or magnet mounting?

Stud for permanent installs. Magnets shift and reduce high-frequency response.

4-20 mA or RS-485?

4-20 mA for one value per point into existing analog I/O; RS-485 for multiple values per sensor on one cable.

Next step

Send your motor list (power, speed, foundation type) and we will help you frame the transmitter spec and alarm limits.

Email: team@embedos.io

Help Us Help You Leverage The Power Of Industrial Automation & Industrial IoT – IIoT.

Flow Meter Pulse Output vs 4-20mA: Which to Use and When

Is pulse output more accurate than 4-20 mA?

For totals, usually yes, because pulses are counted rather than integrated. For live rate, both can work; accuracy then depends on the meter and input.


Direct answer: use the pulse output when you need an accurate total (litres, m³ consumed per shift or batch), and use 4-20 mA when you need the live flow rate for control, trends or alarms.

Pulses are counted, so a total built from them has no integration error beyond the meter’s own K-factor. A total built by integrating a 4-20 mA signal accumulates the small offset, scaling and sampling errors of the analog chain. Many plants wire both: pulses to a counter or totaliser, 4-20 mA to the PLC loop, and a separate flow switch contact for a no flow alarm.

Who this is for: instrumentation and utility engineers wiring water, cooling water, fuel oil, chemical dosing or effluent meters into a PLC, panel totaliser or energy monitoring system.

Do I need a high speed counter input?

If pulse frequency at max flow exceeds the input’s rated counting frequency, or pulse width is shorter than its filter time, yes.

Can I calculate total flow from 4-20 mA?

Yes, by integrating rate over time, but offset, span and sampling errors accumulate. Use a low flow cut-off and check against a pulse or manual reading.

Tell us what you need on site

Need this on your plant? Tell us your requirement

PNP or NPN, which should I choose?

Match the PLC input. Sinking PLC inputs pair with PNP outputs; sourcing inputs, or a pull-up resistor, pair with NPN.

What is a K-factor on a flow meter?

The number of pulses the meter sends per unit volume, such as 50 pulses per litre, from its calibration certificate.

The two signals in one line each

  • Pulse (frequency) output: one pulse per fixed volume. Pulse frequency is proportional to flow rate; pulse count is proportional to total volume.
  • 4-20 mA output: a current that maps the flow range linearly, 4 mA at zero (or range low) and 20 mA at full scale. The live-zero 4 to 20 mA range is standardised in IEC 60381-1:1982 (IEC webstore).

K-factor: turning pulses into litres

The K-factor is pulses per unit volume, given on the meter’s calibration certificate. A KEP application note puts it simply: the certificate gives the average K-factor, for example 200 pulses per US gallon or 150 pulses per litre, and that number is entered into the totaliser (KEP, Calculating and Using K-Factors).

Worked example (illustrative): a cooling water meter has K = 50 pulses per litre.

  • Total: 1,250,000 pulses counted over a shift ÷ 50 = 25,000 L = 25 m³.
  • Rate: pulse frequency 125 Hz ÷ 50 = 2.5 L/s = 9 m³/h.

Field check of K, as Seametrics describes: reset the total, set K = 1, run a known volume into a container, read the pulse count, divide pulses by volume (Seametrics field calibration bulletin). For example 500 pulses into a 10 L can gives K = 50 pulses/L.

Some meters, such as turbine meters, have a K-factor that varies across the flow range. Meter manuals state linearity; one turbine sensor manual lists ±3% of reading linearity and ±0.5% repeatability (GF Signet 2100 manual). If that matters, use a totaliser with multi-point K-factors.

4-20 mA scaling

Rate = range low + (mA − 4) ÷ 16 × (range high − range low).

Example: 0 to 50 m³/h range, signal 12 mA. Rate = (12 − 4) ÷ 16 × 50 = 25 m³/h. You can check your own numbers with our 4-20 mA loop scaling calculator.

Why integrating 4-20 mA drifts

To get a total from 4-20 mA, the PLC samples the rate and adds rate × time each scan. Errors add up:

  1. Zero offset: a meter at true zero sending 4.05 mA reads 0.05 ÷ 16 × 50 = 0.16 m³/h. Over 24 h that is about 3.75 m³ of “flow” that never happened. Use a low flow cut-off.
  2. Span error: analog input and transmitter tolerances scale every reading.
  3. Resolution: an input with limited counts over 4 to 20 mA quantises the rate.
  4. Sampling: if flow pulses or changes fast between samples, the sum misses it.
  5. Restart loss: a PLC restart without retained memory can reset the total.

Pulses avoid points 1 to 4 because each pulse is a counted, fixed volume. They still need retained counters and protection against missed pulses.

PNP, NPN and open collector outputs

Pulse outputs are typically open collector (NPN, sinking), PNP (sourcing), or a passive contact (reed). The input must match:

  • NPN / open collector: the output pulls the line to 0 V. The input must be a sourcing type (it supplies current that the output sinks), or you add a pull-up resistor to supply. Check the meter’s maximum switching current and voltage.
  • PNP: the output drives the line to supply voltage. Use a sinking type PLC input (current flows from the output into the input).
  • Reed or mechanical contact: low frequency only, and contact bounce needs input filtering.

IEC 61131-2:2017 defines Type 1, Type 2 and Type 3 24 V DC digital inputs, each with its own on and off voltage and current limits; read the exact thresholds from your PLC input datasheet (IEC webstore). A pulse output has to cross both thresholds cleanly.

Maximum frequency

At full flow, pulse frequency = K × max flow. Example: K = 50 pulses/L, max flow 5 L/s gives 250 Hz. Check three limits:

  • The meter’s maximum output frequency and minimum pulse width
  • The input’s maximum counting frequency (ordinary PLC digital inputs are filtered; a high speed counter input may be needed)
  • The input filter time, which must be shorter than the pulse width

If frequency is too high, many meters let you set a pulse scaler (one pulse per 10 L). Each pulse then represents more volume, which lowers total resolution but stays accurate.

Download the Free “Flow Signal Wiring and Totaliser Checklist”

Enter your email and you will receive a Sheet, right in your inbox that can be customized by yourself. 


Why add a separate flow switch?

So a no flow condition trips equipment directly, independent of the PLC analog chain.

Cable length and noise

  • 4-20 mA is a current loop, so voltage drop along the cable does not change the reading as long as the loop supply covers transmitter minimum voltage plus load and cable resistance. That makes it tolerant of long runs. Check the loop voltage budget on the transmitter datasheet.
  • Pulse signals are voltage edges. Long cables add capacitance that rounds edges and can pick up spikes from VFD and motor cables, causing false counts. Use shielded cable, earth the shield at one end, keep it away from power cables, and use input filtering suited to the max frequency.
  • In a steel plant or rolling mill bay with large drives, route signal cables in separate trays from power. In process plants with long field runs, 4-20 mA for rate is often the easier signal to keep clean.

Use both, plus a flow switch

A common pattern in Indian utility and process plants:

Need Signal Destination
Shift or batch total, billing, water audit Pulse Counter input or panel totaliser
Live rate, PID loop, trends 4-20 mA PLC analog input
No flow or low flow alarm (pump dry run, cooling water loss) Flow switch contact Hardwired interlock and PLC DI

The flow switch is a separate discrete device (or a configurable meter relay output) so that a loss of cooling water trips a furnace or compressor even if the PLC analog chain fails. Wire it fail safe: contact closed when flow is healthy.

If the meter supports a fieldbus or Modbus output, it may give rate and total over one cable. That is outside this guide’s scope.

If you want a panel display for this, the Em Bose EB series has digital inputs for pulse signals and analog inputs for 4-20 mA, and a Flow Totalizer application. Check the live product page for input ratings against the maximum pulse frequency you worked out above.

Next step

Send your meter datasheet, flow range and what you need (total, rate, alarm) to
Email: team@embedos.io

Also download the free flow signal wiring and totaliser checklist mentioned above. 

Help Us Help You Leverage The Power Of Industrial Automation & Industrial IoT – IIoT.
PT100 to 4-20mA Transmitter or Direct RTD Input?

Wire a PT100 directly to an RTD input when the cable is short and the receiver has a proper PT100 direct input with 3-wire or 4-wire lead compensation.

Use a PT100 to 4-20mA transmitter, usually a head mounted temperature transmitter inside the sensor’s connection head, when the run is long, the area is electrically noisy, or the receiver only has 4-20 mA inputs.

The transmitter converts the small resistance change into a current that cable resistance does not affect, at the cost of one more device to buy, configure and calibrate.

Who this is for: plant, utility and maintenance engineers adding RTD temperature monitoring to tanks, bearings, ovens, cold rooms or process lines, and integrators choosing between RTD and 4-20 mA input cards.

Tell us what you need on site

Need this on your plant? Tell us your requirement

What a PT100 gives you, and why wiring matters

A PT100 is a platinum resistance thermometer with 100 ohms at 0 °C. Its resistance versus temperature relationship and tolerance classes are defined in IEC 60751:2022 (scope and edition). The common -200 °C to +850 °C range and the 0.003851 per °C coefficient are described in TI’s RTD measurement guide SBAA275A. In round numbers that is about 0.385 ohm per °C near room temperature.

That small slope is the whole problem. Every ohm of copper lead resistance that gets counted as sensor resistance reads as roughly 2.6 °C of error. TI’s A Basic Guide to RTD Measurements works through how 2-wire, 3-wire and 4-wire connections handle that lead resistance.

Is PT1000 better for long cables?

A PT1000 has ten times the resistance and ten times the slope, so the same lead resistance causes about one tenth of the error in a 2-wire connection. It still needs a receiver that supports PT1000 and it does not remove noise pickup on long runs.

PT100 3 wire vs 4 wire (and 2 wire)

Connection How leads are handled Lead error Typical use
2-wire Both lead resistances add to the reading Highest, grows with length Very short leads, or a head transmitter mounted at the sensor
3-wire Receiver measures and subtracts lead resistance, assuming leads are matched Small if leads are equal The common industrial default
4-wire Separate current and sense pairs, sense leads carry almost no current Effectively removed Lab, calibration, high-accuracy points

TI’s guide notes that 3-wire compensation assumes matched lead resistances, and that 4-wire connections remove lead resistance error because the sense leads carry no excitation current. In practice, a 3-wire run with mismatched terminals, corroded joints or mixed cable cores loses part of its compensation.

Can I run a 3-wire PT100 on a 2-core plus shield cable?

No, the shield is not a matched conductor. Use three matched cores so the compensation works as intended.

How long can a direct PT100 run be?

There is no single number. It depends on the cable resistance, whether leads stay matched, the noise environment and the receiver’s input design. Many receiver datasheets state a maximum lead resistance; work back from that to cable length. If the run is long and passes VFDs or heavy power cables, a transmitter at the sensor is the safer choice.

embedos-blogs-3-wire-pt100-to-4-20ma-transmitter-embedos-rtd: 3 wire PT100 sensor showing the three lead wires used for lead compensation

PT100 to 4-20mA transmitter: what changes

A head mounted transmitter sits in the sensor’s connection head (or a DIN rail transmitter sits in a nearby junction box) and does the RTD measurement right next to the element. The cable back to the panel then carries a temperature transmitter 4-20mA signal over two wires. Loop current is the same throughout the loop, so cable resistance does not change the reading as long as the loop supply has enough voltage, as explained in TI’s basics of 4-20 mA current loop transmitters. A broken wire drops the loop to 0 mA, below the 4 mA live zero, so the receiver can flag it.

Point Direct RTD input Head mounted 4-20 mA transmitter
Cable 3 or 4 matched cores per point 2 cores per point
Cable length sensitivity Lead resistance and matching matter Mainly loop voltage budget
Noise Millivolt level signal, more exposed Current signal, less affected
Receiver needed RTD input card or module Any 4-20 mA input
Wire break detection Depends on receiver Below 4 mA, visible on any input
Extra items None Transmitter, configuration, loop supply
Calibration Sensor plus receiver Sensor plus transmitter plus receiver
Range Set in the receiver Set in the transmitter (e.g. 0 to 150 °C)
Does the transmitter make the measurement more accurate?

Not automatically. It removes long-cable lead error and reduces noise, but it adds its own accuracy and drift figures, plus the receiver’s 4-20 mA input error. Add the sensor class, transmitter accuracy and input accuracy together when you compare.

Do I still need 3-wire between the PT100 and a head transmitter?

Inside the head the leads are short, so 2-wire error is small, but most head transmitters accept 3-wire or 4-wire and it costs nothing to use it. Follow the transmitter’s wiring diagram.

Cost and maintenance view

A direct RTD input saves the transmitter cost and one configuration step, which suits short runs inside a panel or skid. A transmitter adds hardware cost per point but uses cheaper 2-core cable and any 4-20 mA input, and the 4-20 mA signal is easy to check with a loop calibrator.

On sites with many existing 4-20 mA inputs and long runs, the transmitter route is usually less trouble over the life of the plant. For sensors bonded to earthed metal in noisy areas, choose an isolated transmitter.

Checklist

  • Note cable length and route for each point, and whether it passes VFD or power cables.
  • Check what the receiver accepts: PT100 direct, PT1000, or 4-20 mA only.
  • For direct wiring, use 3 or 4 matched cores and check the receiver’s maximum lead resistance.
  • For transmitters, set the range to fit the process with headroom, and check the loop voltage budget.
  • Decide whether the transmitter needs isolation.
  • Specify the sensor tolerance class to IEC 60751.
  • Plan calibration of sensor and loop together.

Where Embedos fits

Embedos Edge accepts 4-20 mA and 0-10 V DC analogue inputs on devices in the platform (for example Edison or Maxwell). The confirmed path for PT100 points today is: PT100, head mounted or DIN rail 4-20 mA transmitter, then an Edge analogue input scaled to °C. Edge then sends readings over MQTT or HTTPS, keeps data with data buffering during network outages, gives remote visibility of device health and connection status, and can raise threshold alerts by SMS, email or call.

Where temperature already sits in a controller or meter, Edge can read it over RS-485 Modbus RTU or Modbus TCP instead.

The Turing series is the temperature-specialist (Thermocouple / RTD expansion).  Can read RTD or Thermocouple Sensor Inputs directly, log data, and transmit data over MQTT, HTTP with or without TLS, over 4G Sim Card or Wi – Fi, SMS, email or call, directly. 

Next step. Drop a Mail!

The Embedos Turing (ET) series is the temperature-specialist.

Thermocouple / RTD Data Logger /  Gateway.

Email: team@embedos.io

Help Us Help You Leverage The Power Of Industrial Automation & Industrial IoT – IIoT.
Data Center Noise: Sources, Limits and How to Control It

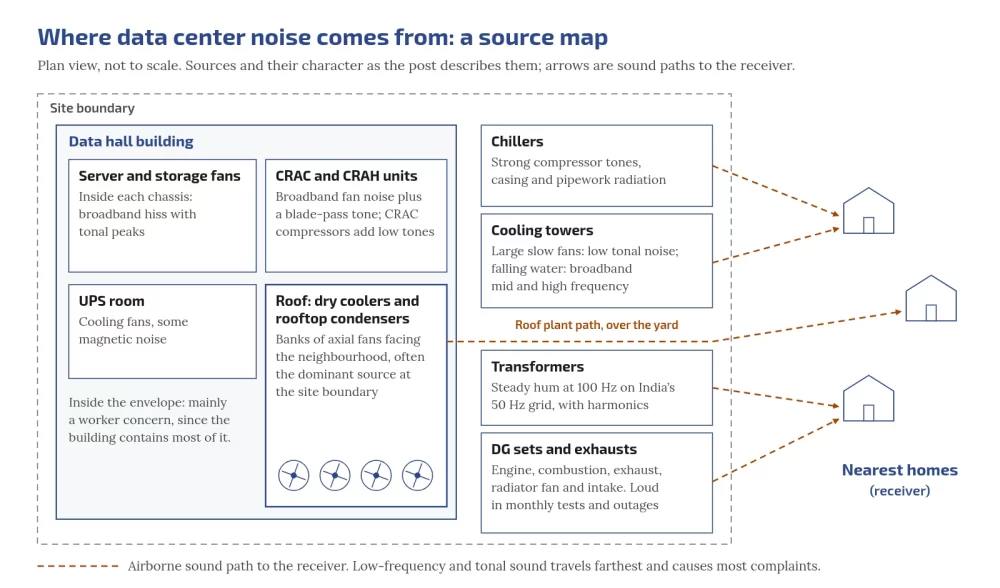
Most data center noise comes from moving air and rotating plant: server fans, CRAH/CRAC units, chillers, cooling towers, dry coolers and rooftop condensers, with diesel generator sets, transformers and UPS rooms adding tonal and intermittent sound.

The part that drives most neighbour complaints is low-frequency and tonal noise, because it travels far, passes walls more easily, and is under-reported by the dB(A) readings many permits use.

Control starts at the source (fan selection and speed), continues along the path (barriers, enclosures, silencers, absorbers, vibration isolation, setbacks) and, for some low-frequency tones in ducts, can be helped by active noise control.

Continuous logging from a third-party sound level meter closes the loop against day and night limits.

For facility, MEP and electrical engineers designing or running data centers and large server rooms in India; EHS managers responsible for worker exposure; project teams facing consent conditions or community complaints near homes.

Tell us what you need on site

Need this on your site? Tell us your requirement

Embedos blogs embedos-blogs: site plan showing CRAH, dry coolers, transformers, DG yard and sound paths to a neighbour house

Where does data center noise come from?

A data center is, acoustically, a large air-moving machine. Almost every watt of IT load becomes heat that air or water must carry away, and every stage of that heat path makes noise.

  • Server and storage fans. Small axial fans at high speed. Individually modest; collectively a dense broadband hiss with tonal peaks inside the white space. Mainly a worker issue; the building envelope holds most of it.
  • CRAC and CRAH units. Compressors and large fans: broadband plus blade-pass tones; CRAC compressors add low-frequency tones.
  • Chillers. Screw, scroll or centrifugal compressors add strong tonal components plus casing and pipe radiation.
  • Cooling towers. Slow fans plus falling-water splash: low-frequency fan tones plus mid/high broadband.
  • Dry coolers and rooftop condensers. Banks of axial fans often dominate at the boundary because they face the neighbourhood with little in between.
  • Diesel generator sets. Mechanical, combustion, exhaust, radiator fan and intake. Quiet most of the time; loud in monthly tests and outages.
  • Transformers. Steady hum at twice supply frequency (100 Hz on India’s 50 Hz grid) with harmonics (ABB transformer noise review).
  • UPS rooms. Cooling fans and, in some designs, magnetic noise from inductors. Usually inside the electrical room, not the fence.

See also transformer and generator hum and fan and cooling acoustics.

Which plant usually dominates at the boundary?

Outdoor heat rejection (dry coolers, condensers, cooling towers) in normal operation, and diesel gensets during tests and outages. Confirm with octave-band data for your own plant.

Broadband, tonal and low-frequency: why the mix matters

  • Broadband: energy spread across many frequencies (air through fans and coils). Annoying when loud; less noticeable than tones at the same level.
  • Tonal: energy at specific frequencies (blade-pass, transformer hum). Assessment methods often add a penalty for tonality (ISO 1996-2 Annex C method described in Pedersen, Acoustics 2008).
  • Low-frequency (roughly 20 to 200 Hz) and infrasound (below about 20 Hz): large slow fans and engines. Low frequencies travel farther and pass walls more easily.
  • Impulsive / intermittent: valve slam, damper actuation, genset start, chiller staging. Communities often complain about change more than about a steady level.

Why low-frequency noise travels so far

Three effects stack:

  1. Long wavelengths. At about 343 m/s, 100 Hz has a wavelength of about 3.4 m. Barriers that are small compared with the wavelength diffract poorly.
  2. Low air absorption. Atmospheric absorption rises with frequency (ISO 9613-1:1993). Over hundreds of metres, highs fade; the low end remains.
  3. Weak partition loss. Single-panel transmission loss rises about 6 dB per doubling of frequency or surface mass in the mass-controlled range (NRC Canada on factors affecting sound transmission loss).
Is a higher boundary wall enough for hum?

Often only partly. At 100 Hz sound diffracts over a typical wall more easily than high-frequency sound. Treat the source, enclosure or vibration path as well.

How to read dB, dBA, dBC and octave bands

Sound pressure level is 20 log10(p/p0) with p0 = 20 µPa. Two equal uncorrelated sources add 3 dB.

A-weighting vs C-weighting. A-weighting strongly discounts low frequencies. Per IEC 61672 values as tabulated by NTi Audio: at 100 Hz, A is about −19.1 dB while C is about −0.3 dB. If dB(C) is much higher than dB(A) at the same point, low-frequency content is present that dB(A) hides. The WHO Guidelines for Community Noise (1999) are widely cited for a practical screen: when dB(C) minus dB(A) is more than 10 dB, a frequency analysis is recommended (Section 4.3 wording; Soft HOLD pending eye-check of the WHO IRIS scan).

Octave or third-octave data shows which machine is responsible. Narrowband FFT matches peaks to fan speed or 100 Hz hum. NR/NC curves rate indoor HVAC noise better than a single dBA number.

How the sound is generated

Blade-pass frequency: BPF (Hz) = blades × RPM / 60 (AMCA Basics of Fan Noise). A 7-blade fan at 1,440 RPM gives 168 Hz.

Transformer magnetostriction: core steel strains with flux magnitude, so vibration is at twice supply frequency: 100 Hz on 50 Hz systems, with harmonics (ABB review).

Diesel firing: for a four-stroke engine, firing frequency ≈ (RPM/60) × (cylinders/2). A 12-cylinder set at 1,500 RPM fires near 150 Hz (illustrative method, not a measured set).

Structure-borne path: compressors, pumps, engines and transformers shake foundations; airborne treatment alone will not stop re-radiated panels. Isolation does.

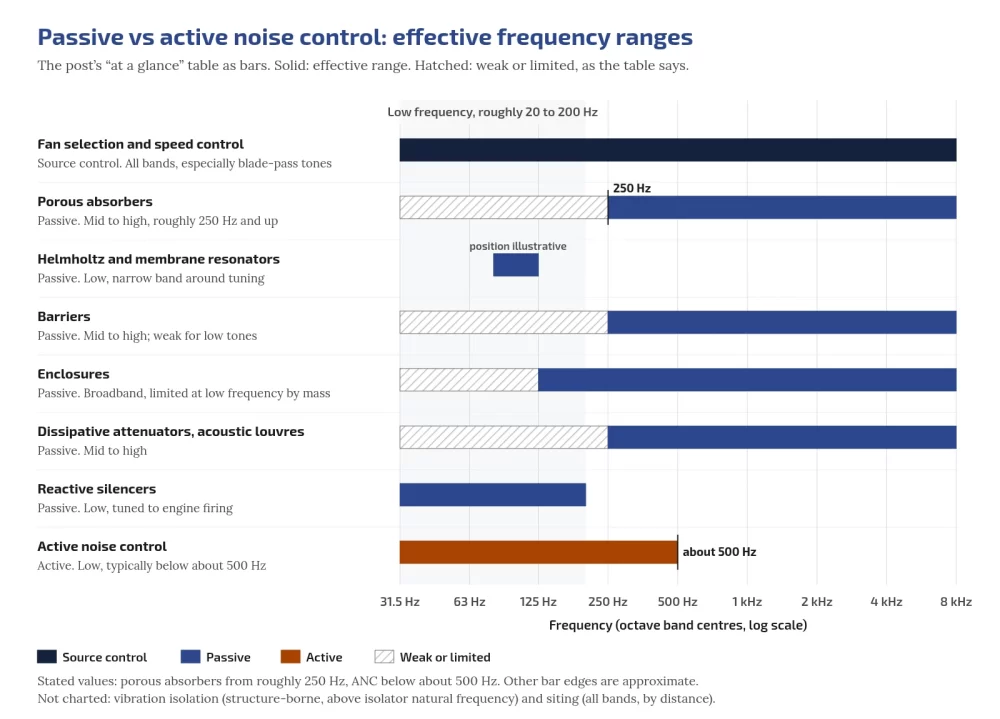
Passive control, then active where it fits

Passive tools (see passive noise control physics):

Method Type Best range Typical DC use
Fan selection and speed control Source All bands, especially BPF tones CRAH, dry coolers, condensers, towers
Porous absorbers Passive Mid to high Plant rooms, enclosure linings
Helmholtz / membrane resonators Passive Low, narrow band Transformer rooms
Barriers Passive Mid to high; weak for low tones Rooftop screens, yards
Enclosures Passive Broadband; limited at low Hz by mass DG sets, chillers
Dissipative attenuators / louvres Passive Mid to high Ducts, vents
Reactive silencers Passive Low, tuned Genset exhaust
Vibration isolation Passive Above isolator natural frequency Chillers, pumps, gensets, transformers
Siting and setbacks Planning All bands Layout
Active noise control Active Low, typically below about 500 Hz Duct/plenum tones when passive is too bulky

Active noise control generates anti-noise of equal amplitude and opposite phase. It fits ducts and predictable tones better than open cooling yards. Detail: active noise cancellation, analog vs digital.

Embedos blogs embedos-blogs: passive vs active noise control across frequency

What limits apply in India, and what WHO says

CPCB ambient limits

The Noise Pollution (Regulation and Control) Rules, 2000 (CPCB consolidated PDF, Delhi consolidated copy)

Zone Day dB(A) Leq Night dB(A) Leq
Industrial 75 70
Commercial 65 55
Residential 55 45
Silence zone 50 40

Day is 6:00 a.m. to 10:00 p.m.; night is 10:00 p.m. to 6:00 a.m. A silence zone is not less than 100 m around hospitals, educational institutions and courts; the State Government may declare it (wording inserted by S.O. 2555(E), 10.08.2017, per CPCB consolidated footnotes).

Night limits are 5 dB lower than day in industrial zones (75 to 70) and 10 dB lower in commercial, residential and silence zones. The residential and commercial night step is where most designs are tested, because cooling runs all night. Limits are A-weighted, so a site can comply on paper while a neighbour still hears a hum.

DG set limits

DG noise limits are in the CPCB DG noise notification (Delhi-hosted copy, noise-limits-for-generaotor-set) Later genset gazettes such as GSR 436(E) deal with supply/transition conditions, not the 75 dB(A) noise limit:

  • New DG sets up to 1000 kVA made on or after 1 January 2005: maximum 75 dB(A) at 1 m from the enclosure surface, integral acoustic enclosure at manufacture.
  • Other sets: enclosure or treated room for minimum 25 dB(A) insertion loss or meeting ambient standards, whichever is higher (IL at 0.5 m points, averaged); exhaust muffler minimum 25 dB(A) IL.

WHO guidance

The WHO Environmental Noise Guidelines for the European Region (2018) recommend reducing road traffic noise below 53 dB Lden and 45 dB Lnight, with other source-specific values.

They do not set a value for industrial or data center plant. WHO’s Night Noise Guidelines for Europe (2009) set a target of 40 dB Lnight,outside and an interim target of 55 dB. ENG 2018 made no recommendation for industrial noise.

Use WHO figures as a health reference for night exposure, not as an Indian compliance limit. Summary: WHO noise compendium chapter.

Workers inside

As a widely used reference, NIOSH recommends 85 dBA as an 8-hour TWA with a 3 dB exchange rate. Generator halls, chiller rooms and dense aisles are the areas to survey. See inside the data hall: staff hearing.

Check applicable Indian factory and state rules for your site.

Can a site meet CPCB dB(A) and still get a valid hum complaint?

Yes. A-weighting subtracts about 19 dB at 100 Hz. A tone can be audible indoors while overall dB(A) stays within the zone limit.

Living near a data center? What residents can log!

Engineering summary, not legal advice.

  • Compare Leq in dB(A) with the zone limit for day and night.
  • Under Rule 7, a person may complain to the authority if noise exceeds the ambient standard by 10 dB(A) or more, or if a night-time restriction is violated (Delhi consolidated Rules).
  • For hum, also log dB(C) at the same spot. Keep date, time, location, what was audible and any visible site activity.

Neighbour health framing: data center noise and neighbours. Pre-build surveys: noise impact assessment in India. Tender clauses: noise specification for equipment tenders. Measurement detail: measuring and monitoring noise.

Continuous logging and where Embedos fits

A one-time survey shows one day. Data center noise changes with IT load, outdoor temperature, chiller staging and genset tests. Continuous logging answers what happened at 2 a.m.

Practical design:

  • Place third-party meters at the boundary facing receivers, near major plant, and in worker areas as needed.
  • Log LAeq for CPCB comparison, LCeq for the C minus A screen, Lmax for impulses, and spectra where the meter supports it.
  • Correlate with plant state (genset run, fan speed, chiller stage).
  • Separate day and night thresholds.

Embedos Edge is our platform. Edge can log readings from a third-party sound level meter, noise meter or recorder via 4-20 mA or 0-10 V analogue inputs. Edge has no built-in microphone and does not do dosimetry; the meter measures.

EmView monitoring/dashboard (EmView=B) can show those logged readings when signed in at emcommandview.embedos.io. Convert a meter’s analogue span to engineering units with the free 4-20 mA loop scaling calculator. Meter class (for example Class 1 under IEC 61672) is a property of the third-party meter, not of Edge.

Does Embedos sell a sound level meter or ANC product?

No. Educational posts cite third-party meters and published ANC research. Embedos Edge logs analogue outputs from meters you specify; It can work with all sort of third party microphones. 

Documented innovations (some inspirations)

  • Zhao et al., IEEE Trans. Ind. Electron. 2017: 8 to 15 dB reduction in a defined area in a 50,000 kVA transformer ANC experiment (DOI).
  • Silentium AcoustiRACK ACTIVE: soundproof rack cabinet quoting up to 30 dB(A) for the cabinet as a whole (Silentium).
  • Ma et al., Nature Materials 2014: absorption coefficient above 0.99 at 152 Hz in a thin metamaterial cell (DOI).
  • ebm-papst AxiBlade: up to 8 dB(A) lower noise than earlier HyBlade series per manufacturer brochure (PDF).
  • Immersion cooling: Vertiv states server fans are not required in its immersion offering; facility heat-rejection plant still makes noise (Vertiv product page).

Next step!

Send your site zone category, nearest receiver distance and which plant sits outdoors, and we will help you plan boundary logging against day and night limits.

Email: team@embedos.io

Help Us Help You Leverage The Power Of Industrial Automation & Industrial IoT – IIoT.