OEE Monitoring System: What to Measure on Shop-Floor Machines

What is an OEE monitoring system?

A setup that collects run state, part counts and reject counts from machines, and calculates availability, performance and quality, and their product, Overall Equipment Effectiveness (OEE)

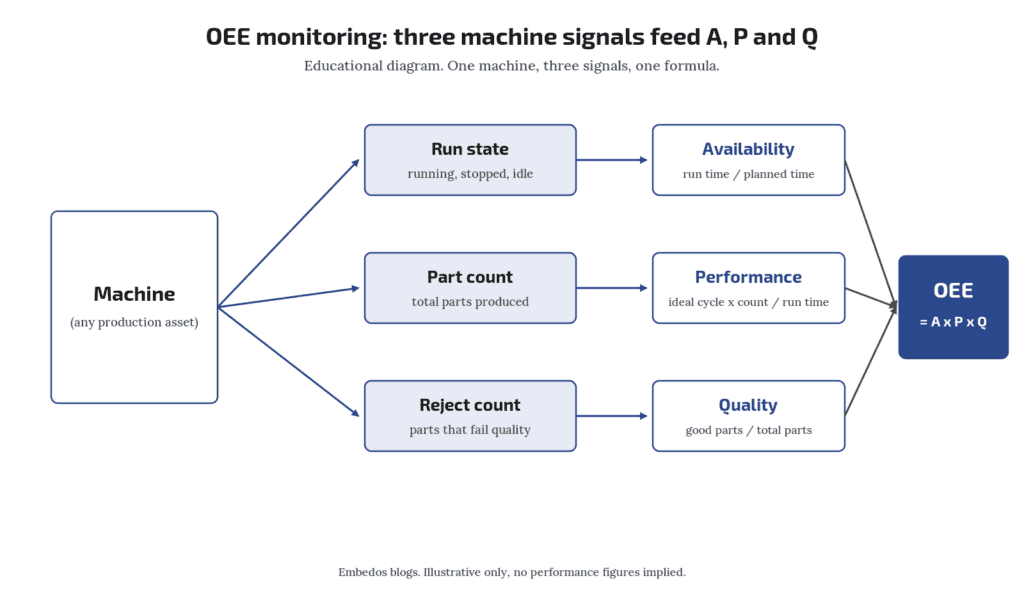
An OEE monitoring system needs three groups of signals from each machine: a reliable running or stopped state (for availability), a part or cycle count against an agreed ideal cycle time (for performance), and a good or reject count (for quality).

OEE is availability × performance × quality.

On mixed-vintage shop floors the hard part is not the formula, it is getting a trustworthy run signal and part count from machines that were never built to report them.

A logging layer or edge gateway can collect those signals and send them to a dashboard or control room; it does not replace your MES, SCADA or PLC.

Who this is for: production, maintenance and automation engineers who have been asked to “show OEE” for a line of presses, CNCs, moulding machines or packing machines of different ages and makes.

Is there a standard definition of Overall Equipment Effectiveness (OEE) ?

ISO 22400-2 defines Overall Equipment Effectiveness (OEE) among its manufacturing KPIs. Plants still need local rules for planned time and rework.
Tell us what you need on site

Need this on your plant? Tell us your requirement


Embedos blogs embedos-blogs diagram: three machine signals, run state, part count and reject count, feeding availability, performance and quality

Why this question keeps coming up

A recent enquiry from an instrumentation firm asked a common thing: their client wanted OEE on a set of older machines and wanted to know what had to be wired before any software discussion. That is the right order. Decide the signals first; the dashboard comes later.

OEE in one formula

OEE is defined as a key performance indicator in ISO 22400-2, the standard for KPIs in manufacturing operations management (ISO 22400-2:2014). In plain terms:

  • Availability = actual run time ÷ planned production time.
  • Performance = (ideal cycle time × total count) ÷ run time.
  • Quality = good count ÷ total count.
  • OEE = availability × performance × quality.

Worked example (illustrative numbers only): a shift has 480 min planned time. The machine runs 420 min, so availability = 0.875. Ideal cycle time is 30 s and it makes 760 parts, so performance = (0.5 min × 760) ÷ 420 = 0.905. 740 parts are good, so quality = 0.974. OEE = 0.875 × 0.905 × 0.974 ≈ 0.77.

Each factor depends on a different physical signal. If one signal is wrong, the OEE number is wrong in a way the formula will not show you. If you want the reasoning for measuring this before buying an MES, read our post on an OEE baseline before MES.

How do I record downtime reasons?

Operator entry on an HMI, button panel or tablet, with a short reason list agreed with production.

Availability: get the run signal right

Availability needs two things: when the machine is running and what counts as planned time.

Run signal options, roughly in order of preference:

  1. A PLC or CNC status bit (cycle active, auto mode, spindle on) read over the machine’s own interface, if one exists. Check the controller vendor’s documentation for which bit means “producing” and not just “powered”.
  2. A spare contact or output from the machine’s control circuit, such as a motor contactor auxiliary contact or a cycle-start relay, wired to a digital input.
  3. Motor current via a current transformer and a threshold. This works on machines with no spare contacts, but you must pick a threshold that separates idle from cutting or pressing. Idling hydraulic pumps can draw a lot of current while nothing is produced.
  4. Spindle or shaft speed from a proximity sensor on a rotating part.

Planned time is a business rule, not a sensor. Agree shift times, breaks and planned maintenance with production before you start, or availability will be argued over forever.

Downtime reasons (no material, tool change, breakdown, waiting for QC) usually come from an operator entry: a button panel, an HMI screen or a tablet. Keep the list short; ten reasons that people actually press beat forty that nobody uses.

Is "machine powered on" good enough as a run signal?

Usually no. A machine can be powered and idle for hours. Use a signal tied to production, such as cycle active, a stroke, or a load threshold on motor current.

Performance: count cycles, not guesses

Performance needs a total count and an ideal cycle time for each product or die.

  • Count source: a stroke or cycle pulse from the controller, a proximity sensor on a moving part, or a photoelectric sensor at the outfeed. For high speed counts, check that the input’s maximum count frequency covers your fastest cycle. Inductive proximity switches are covered in IEC 60947-5-2:2019.
  • Multi-cavity or multi-up tools: one stroke can make several parts. Store parts per cycle with the job, not as a fixed machine setting.
  • Ideal cycle time: take it from the process engineer’s standard, not from last month’s average. If you use an average, poor performance becomes the baseline.

Micro-stops (stops of a few seconds) are often where performance loss hides.

A count signal logged with a timestamp lets you see them later without any extra sensor.

Where do I get ideal cycle time for old machines?

From the process sheet or the machine nameplate rating for that job. If neither exists, run a clean trial with an experienced operator and record the best sustained rate, then get production to agree it in writing.

Quality: the signal most plants skip

Quality = good ÷ total. Sources:

  • Automatic reject: a reject gate, a checkweigher or vision system output, wired as a second count.
  • Operator entry: rejects entered per shift or per lot on an HMI or tablet.
  • Rework: decide up front whether reworked parts count as good. ISO 22400-2 treats quality ratios in terms of good quantity, so write the rule down.

If you only have end-of-shift reject entries, quality will be daily rather than live. That is fine for a first baseline.

Download the Free “OEE Monitoring Signal Checklist”

Enter your email and the form emails you the copy link to the Google Sheet.


Can I measure OEE on machines with no PLC?

Yes, using external signals: contactor auxiliary contacts or a current threshold for run state, and proximity or photoelectric sensors for counts.

Signal checklist for mixed-vintage machines

Use this per machine. It doubles as the downloadable checklist (lead magnet: oee-monitoring-signal-checklist).

Item Newer machine (has controller interface) Older machine (relay logic or none)
Run state Controller status bit over its protocol Contactor aux contact or CT current threshold
Cycle count Controller counter or cycle-complete bit Proximity or photoelectric sensor on stroke or outfeed
Parts per cycle Job recipe Manual entry per job
Reject count Reject station output Operator entry
Downtime reason HMI screen Button panel or tablet
Timestamp source Gateway or server clock synced to NTP Same

Points to check on site:

  • Is there a spare contact, or do you need an interposing relay so you never load the machine’s control circuit?
  • What voltage is the signal: 24 V DC, 110 V AC, 230 V AC? Use the right input or an isolating relay.
  • Can the machine’s own controller be read without affecting its program? Ask the OEM before connecting anything to a running controller.
  • Who owns the clock? Every count and stop should carry one consistent timestamp. NTP is defined in RFC 5905 (IETF).
Do I need to open the machine's PLC program?

Not always. Many retrofits use only external signals (contacts, CTs, proximity sensors) so the OEM program is untouched. That keeps warranty and validation discussions simple.

Where an edge gateway fits, and where it does not

An edge gateway or logger sits between the machine signals and the dashboard. Its jobs are narrow:

  • read digital inputs, counters and analog signals, or poll a controller over Modbus or similar;
  • timestamp and buffer data if the network drops;
  • send data to a server, cloud or control room screen.

It does not run your machine, replace the PLC, or replace an MES that handles work orders, genealogy and scheduling. For retrofit wiring and protocol options on older machines, see retrofitting legacy machines with OPC UA and Modbus. For Modbus itself, the protocol specifications are published by the Modbus Organization.

Embedos Edge is our platform of products, solutions, dashboards, insights and services. On an OEE project it captures machine and sensor data and sends it to the cloud or a control room, with homepage widgets and smart alerts for stoppages. EmView monitoring screens can show the same data in a control room (sign in at emcommandview.embedos.io; )

It sits alongside your PLC, SCADA and MES; it is not a replacement for any of them. Any OEE figure it shows is only as good as the run, count and reject signals you wire into it.
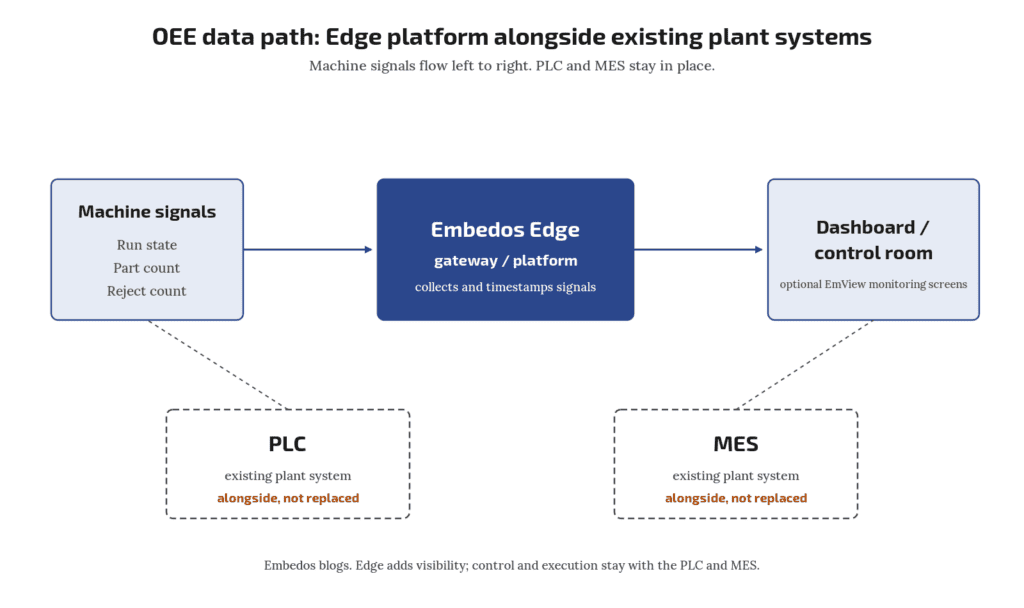
Embedos blogs embedos-blogs diagram: machine signals to edge gateway to dashboard and control room, with PLC and MES shown alongside, not replaced

Common mistakes

  1. Counting from the wrong point. A sensor before a reject gate counts total; one after it counts good. Know which you have.
  2. Mixing ideal and average cycle times across products.
  3. No agreed planned time, so availability changes depending on who reads the report.
  4. Trusting a single number. Always look at A, P and Q separately. An OEE of 0.77 tells you little; availability of 0.875 with performance of 0.905 tells you where to look.
  5. Starting with too many machines. Wire two or three, check the counts against the shift register for a week, then roll out.

Validate before you report

For the first week, compare logged counts with the operator’s shift register and logged stops with maintenance records. Differences point to a bad signal choice, not bad operators. Fix the signal, then publish numbers.

Does an OEE system replace MES or SCADA?

No. It gives you measured losses. MES handles orders and genealogy; SCADA handles supervisory control. A gateway feeds data to them or alongside them.

Next step! Send us a Mail

Send us the stroke, the resolution and speed you need, how the sensor will be mounted (in a cylinder, on a profile or with a wire), the conditions at the sensor head and the input your PLC accepts.

Email: team@embedos.io

Help Us Help You Leverage The Power Of Industrial Automation & Industrial IoT - IIoT.

Digitise a Bursting Strength Tester: Peak Hold to Wi-Fi Log

A manual bursting strength tester can usually be digitised without replacing the machine.

You add a pressure transducer on the hydraulic line, a controller with a display that shows live pressure and holds the peak at the moment of burst, a peak reset and tare, a field where the operator enters GSM. GSM = grams per square metre (g/m²).

So the bursting factor (BF = bursting strength ÷ GSM, with consistent units) is calculated automatically, a serial (RS-485) output to a printer, and a Wi-Fi log to CSV or Excel. The diaphragm, clamp and pumping mechanism stay as they are, so the test method does not change.

Calibration against a traceable reference is still required before results are used.

Who this is for: quality and lab staff in paper, board and corrugated packaging units who run a dial gauge tester today and want readings that are logged, not written by hand.

Tell us what you need on site

Need this on your plant? Tell us your requirement

How is bursting factor calculated?

Bursting factor = bursting strength ÷ grammage (GSM).

In the kgf/cm² convention it is multiplied by 1000. In SI terms, burst index = burst strength in kPa ÷ GSM, in kPa·m²/g.

Can I keep my existing manual tester?

Often yes, if the clamp, diaphragm and pump are in good condition. The retrofit adds sensing and logging; it does not repair worn mechanics.

How a bursting strength test works

Bursting strength is the hydraulic pressure needed to rupture a sheet clamped over a circular rubber diaphragm. The 1966 edition of IS 1060 Part 1 describes the tester as hydraulic pressure, transmitted through glycerine or compressed air, acting on a pure gum rubber diaphragm in contact with the paper, and it asks that the gauge be chosen so each reading falls between 25% and 75% of the gauge capacity (IS 1060 (Part 1) 1966, public text). Today the bursting strength method for paper is IS 1060 (Part 6/Sec 2):2024, identical to ISO 2758:2014 (Intertek Inform listing for IS 1060 (Part 6/Sec 2):2024). IS 1060 Part 1:2022 (amended October 2025) is a separate part covering general purpose tests. The international methods are ISO 2758:2014 for paper and ISO 2759:2014 for board.

On a manual tester the operator watches a dial with a lazy (maximum) pointer and reads the peak after the sheet bursts. The weak points are reading error, a lazy pointer that sticks or is not reset, and results copied by hand into a register.

Retrofit or buy a new digital machine?

QuestionRetrofit points toNew machine points to
Mechanical conditionClamp, diaphragm and pump are soundFrame, pump or clamp are worn
What is missingDisplay, peak hold, loggingMotorised drive, controlled pumping rate
Method complianceExisting method already accepted by your customersCustomer asks for a specific standard machine
DowntimeShort change on siteFull replacement and requalification

Note the pumping rate. The 1966 IS 1060 text (clause 12.5.2) asks for pressure to rise at about 0.75 kg/cm² per second and does not recommend hand operated hydraulic testers as standard practice. If your manual tester is hand cranked and the rate varies by operator, a display alone will not fix that, and a motorised drive may matter more than the electronics. Check the rate of loading in the current IS 1060 (Part 6/Sec 2) or ISO 2758 text before you decide.

We are not giving cost comparisons in this guide; get quotes for both routes on the same feature list below.

The feature list

Live pressure and peak hold

A pressure transducer on a tee in the hydraulic line replaces, or sits beside, the dial gauge. Size its range so normal bursts fall in the middle of its span; the same 25% to 75% idea from IS 1060 applies. Ask for the transducer’s datasheet accuracy, overload rating and media compatibility with glycerine.

The controller samples pressure fast enough to catch the peak. At burst, pressure drops sharply; the controller must hold the highest value seen. Ask the supplier what sample rate the peak detection uses and how they verified it against a reference gauge. No sample rate figure is stated here because it depends on the hardware chosen.

Peak reset and tare

  • Peak reset: a button (or automatic reset on the next pressure rise) clears the held value. A missed reset is the digital version of a stuck lazy pointer, so the log should record the reset event.
  • Tare (zero): zeroes the reading with the clamp open and no pressure, removing transducer offset. Do it at the start of each shift and log it.

Bursting factor from GSM

The operator enters the grammage (GSM, g/m² measured per ISO 536) of the lot. The controller computes:

Bursting factor = bursting strength ÷ grammage

Units must match. Common practice is bursting strength in kgf/cm² multiplied by 1000 and divided by GSM, or bursting strength in kPa divided by GSM to give the burst index in kPa·m²/g. ISO 2758 reports burst index as kPa·m²/g. Pick one convention, show the unit on screen and in the log, and do not mix them between reports.

Worked example (illustrative numbers): a board with 150 GSM bursts at 6.0 kgf/cm². 1 kgf/cm² = 98.0665 kPa (by definition of the kilogram-force, NIST SP 811), so 6.0 kgf/cm² = 588.4 kPa. Burst index = 588.4 ÷ 150 = 3.92 kPa·m²/g. Bursting factor in the kgf convention = 6.0 × 1000 ÷ 150 = 40.

RS-485 printer output

Many lab printers accept serial input. RS-485 (TIA/EIA-485) is a differential bus that tolerates long cable runs and plant noise better than single-ended links (TI SLLA272). Agree the print format: date, time, operator, sample ID, GSM, peak, BF, units. If the printer only has RS-232, a converter is needed; ask who supplies it.

Wi-Fi log to CSV or Excel

Each test becomes one row: timestamp, sample ID, operator, GSM, peak pressure, BF, tare and reset events. Ask:

  • Where the file lives (on the device, on a PC share, or in a cloud folder)
  • What happens if Wi-Fi drops mid shift (local buffer, then sync)
  • Whether the file can be edited after the fact (for audit, it should not be, or edits should be logged)
  • Whether the export opens directly in Excel without reformatting

Calibration and traceability

A digital display is only as good as its calibration. Ask for calibration of the pressure chain (transducer plus controller) against a reference traceable to national standards; in India that traceability runs to the CSIR National Physical Laboratory (CSIR-NPL), typically through an NABL accredited lab (NABL). Also keep the diaphragm check described in your test standard, since a stiff or worn diaphragm affects results regardless of electronics.

We make no accuracy claim for any retrofit here. Accuracy depends on the transducer, controller, calibration and mechanics, and should be stated on the calibration certificate.

How often should the pressure chain be calibrated?

Follow your quality system and customer requirements. Set the interval in your quality system; this guide does not mandate one.

Does digitising make my results comply with IS 1060?

No. Compliance depends on following the method: apparatus, conditioning, rate of loading and calibration. Electronics help you record results reliably.

Download the Free “Burst Tester Digitisation Checklist”

Enter your email and the form emails you the copy link to the Google Sheet.


Questions to ask any retrofit supplier

  1. Which transducer range and accuracy class, and is it rated for the hydraulic medium?
  2. How is peak captured, and how was it verified against a reference?
  3. Is tare and peak reset logged?
  4. Which BF convention and units are used, and can the GSM be entered per lot?
  5. What print format goes to the RS-485 printer?
  6. Where is the log stored, what happens when Wi-Fi drops, and is it tamper evident?
  7. Who calibrates, against what reference, and how often?
  8. Does the retrofit change anything mechanical (pump, clamp, diaphragm)?

Where an HMI controller can fit

If you would rather build the retrofit around a panel HMI than a dedicated indicator, the Em Bose EB series has analog inputs for 4-20 mA or 0-10 V transducers, RS-485 for a serial printer or PC link, and HMI and application logic. Peak hold and bursting factor calculation on it are application and configuration dependent, so they are set up per project, not a standard feature. Embedos does not sell a bursting tester product, and nothing here is a certified test claim.

FAQ

What is a digital bursting strength tester?

A burst tester that measures pressure electronically and displays it, usually with peak hold, bursting factor calculation and data output, instead of reading a dial gauge by eye.

Why log tare and peak reset events?

They show that every test started from zero and that a held peak was not carried over from the previous sample.

Next step

Send a photo of your tester’s gauge and nameplate, and the fields you want in the log, to

Email: team@embedos.io.

Help Us Help You Leverage The Power Of Industrial Automation & Industrial IoT – IIoT.

Retrofitting Legacy Machines and PLCs with OPC UA or Modbus

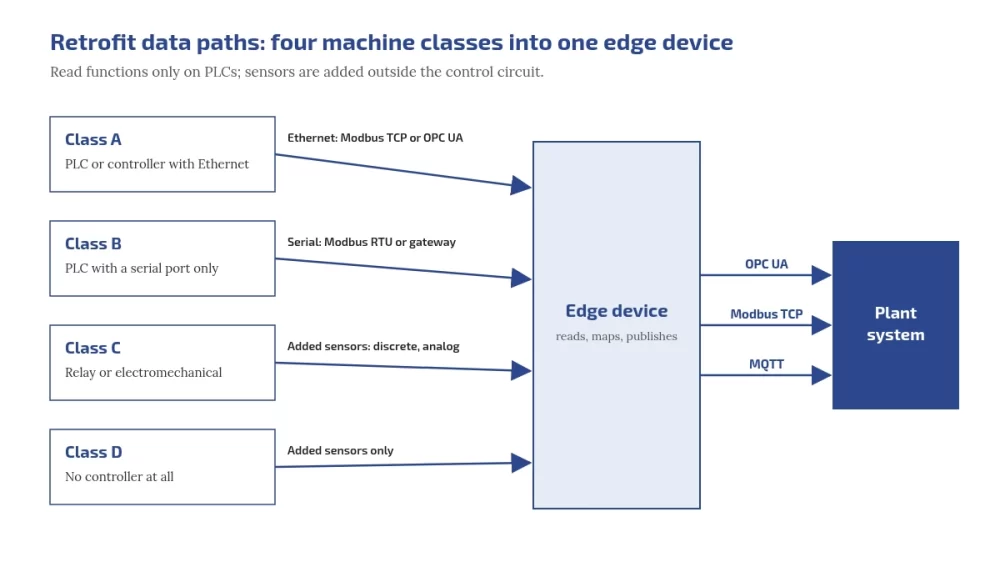
You can retrofit legacy machines without touching their control logic. Classify each machine first: PLC with Ethernet, PLC with serial only, relay or electromechanical, or no controller at all. Then read the PLC over Modbus or OPC UA using read functions only, or add sensors outside the control circuit where there is no usable PLC. Publish everything upwards through open protocols, and use OPC UA where you need structure and security that plain Modbus does not give.

Who this is for:

Plant heads deciding between retrofit and replacement, and the maintenance and automation engineers who have to connect mixed-age machines and older PLCs.

Embedos blogs photo of an older centre lathe in a working metal workshop, beside a staircase and waste bins

What you'll be able to do after reading:

Classify your machines, choose Modbus, OPC UA or added sensors per machine, map Modbus registers to OPC UA variables, plan a first retrofit that cannot write to a PLC, and judge when to replace instead.

Why retrofit before you replace?

A machine that still makes good parts usually has years of mechanical life left even when its controls are old. Retrofitting adds data without changing how the machine runs, so it costs a fraction of a replacement in money and downtime and can start on one machine. Replacement makes sense when spares, support or safety, not data, are the problem; the questions for that decision are further down.

Step 1: classify every machine

ClassWhat it hasTypical data path
APLC or controller with EthernetModbus TCP, or the controller’s OPC UA server if it has one
BPLC with a serial port onlyModbus RTU if the PLC can act as a Modbus slave, or a protocol gateway
CRelay or electromechanical controlsDiscrete and analog signals from added sensors
DNo controller at allAdded sensors only

Walk the floor with this table: note panel space, nameplates, existing ports and spare terminals for each machine. A closed controller with no documentation goes into class C or D, even if it has a port.

Step 2: choose the data path per class

PointAdded sensors (current, 4 to 20 mA, RTD, counts)Reading the PLC (Modbus or OPC UA)
Touches the control systemNo, if mounted outside the control circuitA connection to its communication port, configured to use read functions only
Signals availableOnly what you measureEverything the PLC knows, if documented
Downtime reasonsOperators tag themAlarm and fault codes, if mapped
Dependence on the machine builderLowHigher: you need the memory map or tag list
Best forClasses C and D, quick uniform run and idle dataClasses A and B with documented controllers

How do you connect a PLC to the internet or cloud?

Not directly. CISA’s first OT mitigation is to remove OT connections to the public internet. Connect the PLC to an edge device on the OT network; the edge device reads it and sends data onward over a controlled, outbound route.

Can we use the machine's existing sensors?

Sometimes, through the PLC. Splitting an existing analog signal can disturb the control loop, so add a separate sensor when in doubt.

Embedos blogs diagram of four machine classes feeding one edge device: Class A PLC with Ethernet over Modbus TCP or OPC UA, Class B PLC with serial port only over Modbus RTU or a gateway, Class C relay or electromechanical controls through added discrete and analog sensors, Class D with no controller through added sensors only. The edge device publishes OPC UA, Modbus TCP and MQTT to the plant system.

Worked example: scaling a 4 to 20 mA signal

A pressure transmitter on a 0 to 10 bar range, a 150 ohm sense resistor, and a 12-bit ADC with a 3.3 V reference. The loop reads 12.6 mA. These numbers match the free tool to scale 4-20 mA signals from relay-era machines.

  1. Sense voltage = 12.6 mA × 150 ohm = 1.890 V.
  2. ADC counts = (1.890 ÷ 3.3) × 4095 = 2345.
  3. Process value = 0 + ((12.6 − 4) ÷ 16) × 10 = 5.375 bar.
  4. At 4 mA the ADC reads 745 counts, at 20 mA 3723 counts, so resolution is about 0.0034 bar per count.
  5. At or below 3.6 mA, or at or above 21 mA, NAMUR NE 43 treats the signal as a failure, for example a transmitter fault or a broken wire, so alarm on it instead of showing 0 bar. Readings from 3.8 to 4.0 mA and 20.0 to 20.5 mA are still valid, just under or over range. NE 43 itself is a paid NAMUR document; Beckhoff’s documentation summarises its limits.

A 250 ohm resistor puts 20 mA at 5 V, which clips a 3.3 V ADC. For ovens, dryers and moulds, check temperature readings with the RTD PT100 and PT1000 calculator, including the error a 2-wire RTD adds through its leads.

What does OPC UA add over Modbus?

PointModbusOPC UA
Data modelNumbered registers and coils; meaning lives in a separate documentNamed, typed nodes in an information model that clients can browse, as the OPC UA overview describes
Machine descriptionNoneCompanion specifications such as OPC 40001-1 Machinery: identification, state, counters
SecurityNone in plain Modbus; Modbus/TCP Security adds TLS on port 802Built in: application authentication, signing and encryption, per the OPC UA security model
Typical role in a retrofitReading old devicesPublishing structured data upwards

OPC UA is an open, royalty-free set of standards from the OPC Foundation, as the Machinery specification notes, and the full specifications are free to read online. So the usual answer to “OPC UA vs Modbus” in a retrofit is both: Modbus at the bottom, OPC UA at the top. The OPC Foundation also publishes an open-source edge application, UA Edge Translator, that translates other protocols into OPC UA.

Download the Free “Legacy Machine Retrofit Playbook (Checklist)”!


What is OPC UA used for?

Exchanging industrial data between machines, controllers and plant or business systems, with an information model and built-in security.

OPC UA vs Modbus: which should I use?

Modbus is often all an old device speaks. OPC UA is better for publishing structured, secured data upwards. Many retrofits use both.

Is OPC UA secure, and is it free?

Its security model includes authentication, signing and encryption. The standards are royalty free and readable online, and the OPC Foundation publishes open-source code.

Modbus to OPC UA gateways: mapping registers to variables

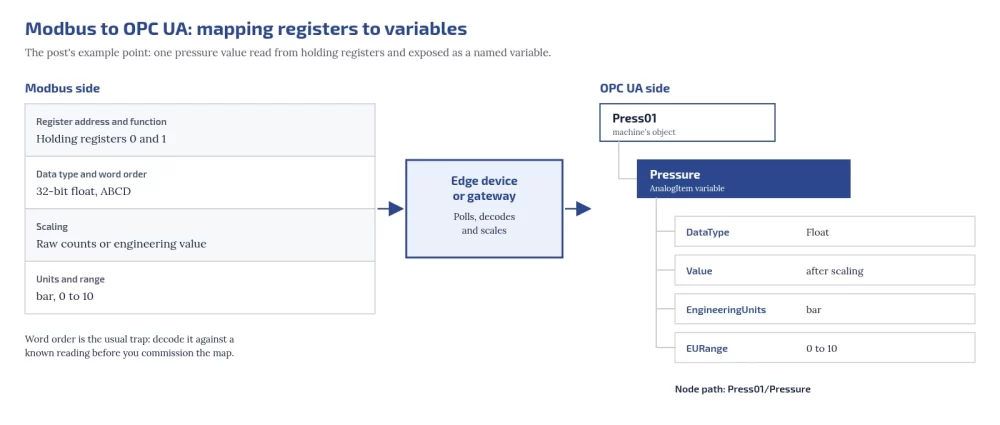
An edge device or gateway polls Modbus and exposes each value as an OPC UA variable. For every point, define:

Modbus sideOPC UA sideExample
Register address and functionNode name under the machine’s objectHolding registers 0 and 1 → Press01/Pressure
Data type and word orderDataType32-bit float, ABCD → Float
ScalingValue after scalingRaw counts or engineering value
Units and rangeEngineeringUnits and EURange of an AnalogItembar, 0 to 10

Wikipedia’s OPC Unified Architecture article is useful further reading on OPC UA itself. Word order is the usual trap: decode Modbus float word order against a known reading before you commission the map. For the transport underneath, see Modbus RTU vs Modbus TCP.

embedos-blogs diagram mapping a Modbus point to an OPC UA variable: holding registers 0 and 1, 32-bit float with ABCD word order, scaling, and bar with a range of 0 to 10 pass through an edge device or gateway that polls, decodes and scales them into the AnalogItem variable Press01/Pressure with DataType Float, a scaled value, EngineeringUnits bar and EURange 0 to 10.
How does a Modbus to OPC UA gateway work?

It polls Modbus registers, decodes and scales them, and exposes each as a named OPC UA variable with type and units.

Start with read functions only

Modbus has no read-only mode, and OPC UA has none by default: any client that reaches the port can send write function codes (05, 06, 15 and 16 in the Modbus application protocol specification) unless something blocks them. So “read-only” is a configuration the integrator must enforce: disable or block write function codes in the edge device or gateway, and do not enable writes until change control is in place. NIST SP 800-82 Rev. 3 and CISA’s OT mitigations also call for segmenting IT and OT networks, changing default passwords and securing remote access.

Do we need OEM permission, and does it affect the warranty?

  • Sensors outside the control circuit do not change how the machine runs. Still inform the OEM while under warranty.
  • A connection to an existing communication port that is configured to use only read functions does not change the PLC program. Disable or block write function codes in the edge device or gateway, but the OEM may still need to tell you the settings and memory map.
  • Any change to the PLC program, safety circuits or control wiring needs written OEM approval while under warranty. Do not do it for monitoring. Check your contract in every case.

What happens to production during the install?

  1. Survey while the machine runs.
  2. Prepare and test the edge device and configuration off the machine.
  3. Install sensors and cabling during an existing planned stop.
  4. Connect to the PLC with write function codes blocked at the edge device, and confirm the HMI and control behave as before.
  5. Run in parallel with manual logs until the numbers agree.
Should a retrofit start read-only?

Yes, in practice: block write function codes at the edge device or gateway, because neither Modbus nor OPC UA is read-only by default.

Embedos blogs photo of a Siemens Simatic S7-300 PLC with CPU and I/O modules on a mounting rail

A pilot plan: one line, a fixed window, clear measures

  1. Pick one line, including its constraint machine.
  2. Agree the window in advance and do not move it.
  3. Measure run state, part counts, downtime with reasons, and one or two process values that explain quality.
  4. Compare against manual logs, then use the data for an OEE baseline.
  5. Decide the next line only once the first line’s numbers are trusted.
How many signals per machine should we start with?

Run state and part count. Add process values only where they explain quality or downtime.

Retrofit vs replace: questions for the plant head

  • Are spares for the controller still available, and from whom?
  • Does the OEM still support the controller and its software?
  • Is the problem missing data, or unreliable control and safety?
  • How much downtime would a replacement need, and when could the plant afford it?
  • Will a retrofit now still be useful if the controller is replaced later?

Will a retrofit lock us into one vendor?

It does not have to. Put these in the order: data published over open protocols such as OPC UA, Modbus TCP or MQTT; raw data exportable in an open format such as CSV without a licence fee; full tag documentation; standard signals (4 to 20 mA, RTD, 24 V digital); and configuration backups handed to the plant.

Who should own the retrofit?

Maintenance or automation engineering for the hardware, with production agreeing what the data must answer.

Where does Embedos fit?

The Embedos Edge IoT gateway page lists Modbus RTU, Modbus TCP, CAN bus and OPC UA among supported protocols, and MQTT, HTTP and HTTPS for sending data onward. Our page on connecting PLCs and controllers describes how we work with automation engineers. For a new plant, put connectivity in the tenders instead, with the greenfield plant digital readiness checklist.

For engineers: check your loop scaling with the free 4 to 20 mA loop scaling calculator and your temperature readings with the RTD PT100 and PT1000 calculator.


Next step

Logging these sensors across the plant? Embedos Edge takes analog and digital I/O. Book a 20 min commissioning call.

Connecting this machine to your plant system? We build OPC UA links end to end. Email team@embedos.io about OPC UA integration.

Ultrasonic Proximity Sensor: When It Beats an Inductive Sensor? When it beats a Photo electric Sensor? | Guide

An ultrasonic proximity sensor beats an inductive sensor when the target is not metal, or is metal but too far away for an inductive field.

It beats a photoelectric sensor when the target is transparent, shiny or dark, or the air is dusty enough to blind a lens.

It measures distance from the echo time of a sound pulse, so colour, transparency and surface shine do not matter.

It has limits that matter in a steel plant: a blind zone just in front of the face, a beam that spreads with distance, a range that falls in heavy dust, hot air and humidity, and unreliable echoes from red-hot stock, where air turbulence scatters the sound.

Use inductive for metal targets close to the face (millimetres to a few tens of millimetres, per the datasheet), ultrasonic for non-metal, liquid, bulk or transparent targets at centimetres to metres, and a sensor built for hot targets near red-hot steel.

Who this is for: instrumentation and electrical engineers in steel, sinter, coke, cement and power plants writing a spec for presence, position or level detection where inductive and photoelectric sensors have already given trouble.


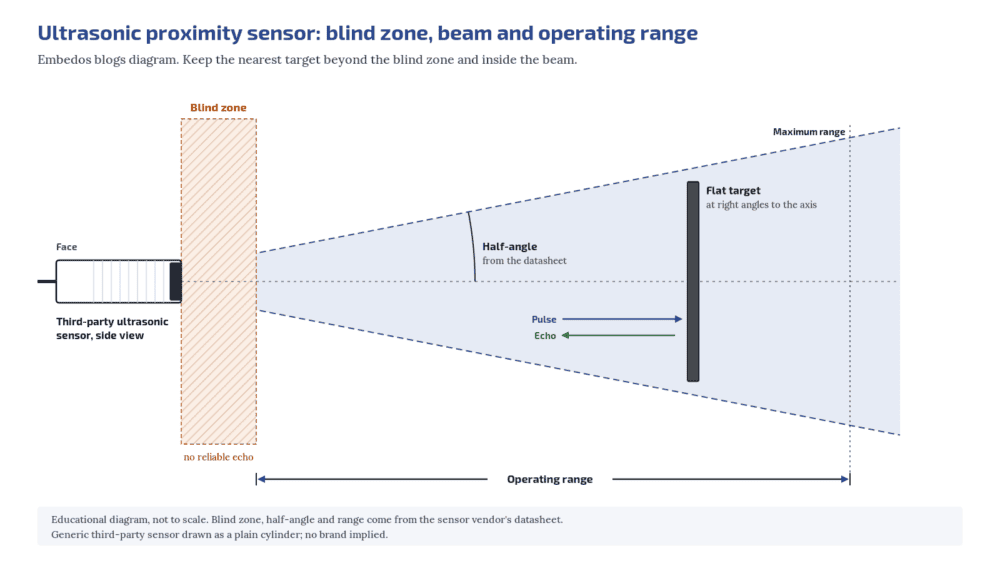
embedos-blogs-ultrasonic-embedos-blind-zone-beam: Embedos blogs diagram of an ultrasonic proximity sensor showing the blind zone in front of the face, the cone-shaped beam and the operating range

Tell us what you need on site

Need this on your plant? Tell us your requirement

How an ultrasonic proximity sensor works

The sensor sends a short pulse of ultrasound and times the echo from the target. Knowing the speed of sound, it works out the distance and then either switches an output at a set distance or gives an analog value proportional to distance. Pepperl+Fuchs‘ technology guide is a clear primary reference on the principle and its limits 

Ultrasonic proximity switches are covered, along with inductive, capacitive and photoelectric types, by IEC 60947-5-2.

Its scope describes ultrasonic types as sensing “the presence of sound reflecting objects”, and that phrase is the key to selection: if the target reflects sound towards the sensor, it can be detected, whatever its material or colour.

Can an ultrasonic sensor detect hot steel?

Not reliably near red-hot stock. Hot objects cause air turbulence that scatters the sound. Use a sensor designed for hot targets.

Where ultrasonic beats inductive

An inductive sensor detects metal only, and only within a short distance of its face. Ultrasonic is the better choice when:

  • The target is not metal. Coal, sinter, limestone, refractory bricks, wooden pallets, rubber belts, plastic, glass and liquids all reflect sound.
  • The gap is large. Ultrasonic sensors work from a few centimetres up to several metres depending on the model, which lets you mount the sensor out of the way of moving equipment and falling material.
  • You need a distance, not just presence. With an analog output, the same sensor reports how far away the target is, for example the height of material in a chute or bin.
  • Metal dust and scale would trigger an inductive sensor. Metallic fines or mill scale building up on an inductive face can cause false switching. Light dust on an ultrasonic transducer does not affect the measurement.
Does steam affect ultrasonic sensors?

Humidity reduces range, and water droplets or condensation on the face impair the sensor. Mount away from the steam path and keep the face dry.

Where ultrasonic beats photoelectric

Photoelectric sensors depend on light reaching the receiver. Ultrasonic wins when:

  • The target is transparent or shiny. Glass, clear film, water and polished metal are hard for diffuse photoelectric sensors. To an ultrasonic sensor, colour is of no consequence and surfaces can be rough, smooth, glossy or transparent.
  • The air carries dust or the lens gets dirty. Light dust and dirt deposits on an ultrasonic transducer do not influence the measurement. A photoelectric lens in a coal handling or sinter area needs air purge and cleaning to keep working.
  • The target is dark or changes colour. Colour does not change the echo.
Is ultrasonic better than inductive in a dusty plant?

For non-metal or distant targets, yes. For a metal target close to the face, inductive is simpler, usually faster and unaffected by non-metal dust.

Where ultrasonic struggles: steel plant conditions

Ultrasonic is not a fix for every harsh area. Check each of these against your location.

Red-hot stock. Particularly hot objects such as red-hot metal create strong air turbulence, and the ultrasound can be scattered or deflected so that no usable echo returns.

Do not use a general ultrasonic sensor to detect hot billets, slabs or bars at a mill stand. Use a sensor designed for hot targets; laser distance sensors, for example, are sold for measuring hot steel slabs in steel mills (SICK Dx1000 overview).

Air temperature. The speed of sound changes by about 0.17% per degree Celsius. As an illustration, a 40°C rise in air temperature changes the speed of sound by roughly 7%, which on an uncompensated reading at 1 m is about 70 mm.

Most industrial ultrasonic sensors have a temperature probe and compensate for this, but the probe reads the air at the sensor, not along the whole path.

A path that crosses hot and cold air layers, as near furnaces and ladles, still adds error. Check the operating temperature on the datasheet; one vendor states a working range of about -25 to +70°C for most of its sensors, which rules out many spots in a melt shop.

Heavy dust, steam and humidity. Heavy dust, rain or snow reduces acoustic energy and shortens the maximum range, and range also falls with rising temperature and humidity. Water droplets or crust on the transducer face impair the sensor. In steam, condensation on the face is the bigger risk: mount the sensor away from the steam path, angled so water runs off, or use a protective enclosure as the maker suggests.

Sound-absorbing targets. Soft, fibrous or foamy targets (felt, wool, foam rubber) return weak echoes and shorten the range.

Slanted smooth surfaces. A smooth surface must face the sensor at close to 90 degrees, or the echo goes elsewhere. Rough surfaces, such as heaps of coarse material, tolerate much larger angles at reduced range.

Noise and neighbours. External noise at the same frequency as the sensor, such as stone being dumped into a silo, can mask the echo. Two ultrasonic sensors close together can hear each other’s pulses; use models with synchronisation or multiplex inputs and follow the maker’s minimum spacing.

Gas other than air. Ultrasonic sensors are designed for atmospheric air. In other gases, such as carbon dioxide, the speed of sound and attenuation change and measurement can fail.

Replacing a sensor that keeps failing in a dusty bay?

Tell us the target, the distance and the conditions at the mounting point, and we will help you check the sensor type.

What is the blind zone of an ultrasonic sensor?

The area just in front of the face where the sensor cannot detect a target because the transducer is still ringing from its own pulse. The datasheet gives its size.

Blind zone and beam angle: the two numbers to read first

Blind zone.

The transducer keeps vibrating for a moment after it sends a pulse, so it cannot receive an echo straight away. That creates a blind zone directly in front of the face where targets cannot be reliably detected (EGE ultrasonic sensors brochure).

Mount the sensor so the nearest possible target position is beyond the blind zone stated on the datasheet.

Thru-beam ultrasonic sensors, with separate emitter and receiver, have no blind zone.

Beam angle.

The sound leaves in a cone. Makers define the edge of that cone differently.

The beam angle is the angle at which the pulse energy is “reduced of 33% of its maximum value”, and a flat target should not be tilted by more than half the beam angle.

Pepperl+Fuchs instead publishes sound beam diagrams measured with a standard 100 × 100 mm plate and a 25 mm rod. Compare beam angles only within one maker’s definition, and read the diagram for a target like yours.

A wide beam picks up nearby structures such as chute walls, rails and brackets; a narrow beam needs careful aiming.

Draw the cone on your layout drawing, at the working distance, before you fix the mounting point.

Operating modes

  • Diffuse (direct detection): one sensor head; the target itself reflects the pulse. Simplest to install. Has a blind zone.
  • Retro-reflective: the sensor watches a fixed reference reflector, such as a plate or wall, and switches when a target disturbs that echo. Recommended for sound-absorbing or slanted targets, and has no blind zone in this mode.
  • Thru-beam: separate emitter and receiver facing each other. Longest range, most resistant to disturbance and fastest switching; needs two heads and two cables.

Outputs and wiring

Ultrasonic sensors come with switching outputs (PNP or NPN, NO or NC), analog outputs (current or voltage, rising or falling with distance), or both.

Many can be taught their switching points or analog limits by a button, a teach input, a potentiometer or software.

For a switching output, match PNP or NPN to the input card as you would for an inductive sensor.

For an analog output, prefer 4-20 mA for cable runs from the field to the panel; the current loop is standardised in IEC 60381-1.

An ultrasonic sensor has to wait for each echo, so its switching frequency is usually below 10 Hz, or up to about 100 Hz for thru-beam types.

Standard inductive sensors are usually rated in the hundreds of hertz or more, though some long-range and weld-immune inductive types are much slower.

Ultrasonic is the wrong choice for counting gear teeth or fast slots on a shaft.

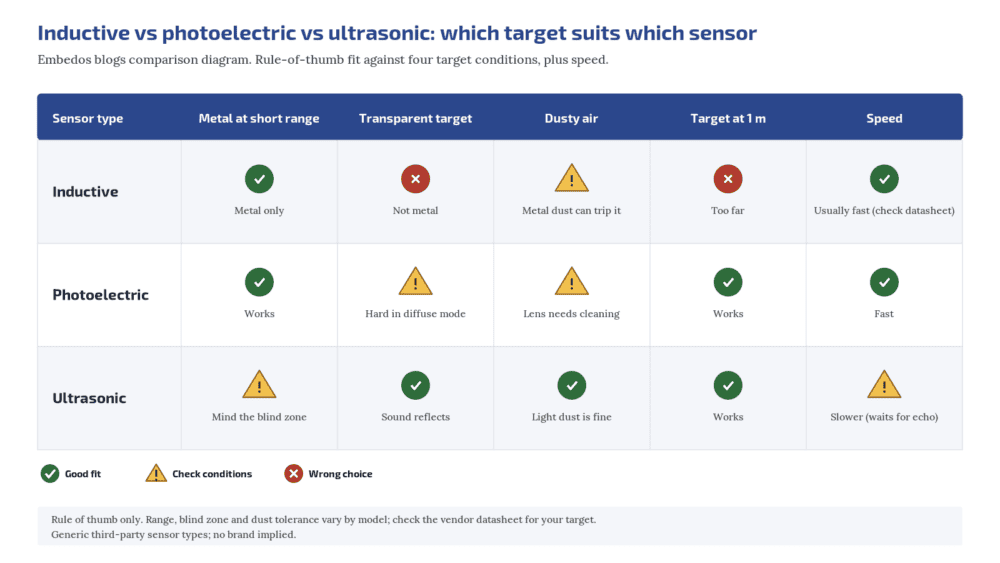
embedos-blogs-ultrasonic-embedos-vs-inductive-photoelectric: Embedos blogs comparison diagram of inductive, photoelectric and ultrasonic proximity sensors against metal, transparent, dusty and distant targets, plus speed
Can I mount two ultrasonic sensors side by side?

Only with enough spacing or with synchronisation, otherwise they hear each other. Follow the maker’s spacing guidance.

Ultrasonic proximity sensor selection checklist

Check Ultrasonic Inductive Photoelectric
Target material Any sound-reflecting target Metal only Any, but colour and shine matter
Range Centimetres to metres Short: millimetres to tens of mm Centimetres to metres
Transparent or shiny target Good Metal only Difficult in diffuse mode
Dust on the face Light dust not critical Metal dust can false-trigger Needs purge and cleaning
Heavy dust, steam Range drops; keep face dry Fine for non-metal dust Range drops
Red-hot stock nearby Avoid; use a hot-target sensor Check temperature rating Use a hot-target type
Near-face target Blind zone applies Fine Mode dependent
Speed Slower (waits for echo) Usually fast (check datasheet) Fast
Output PNP / NPN, 4-20 mA / 0-10 V PNP / NPN PNP / NPN, some analog
Standard IEC 60947-5-2 IEC 60947-5-2 IEC 60947-5-2

Where Embedos fits

Choose the sensor using the checks above.

If you want to log the distance or level, an ultrasonic sensor with a 4-20 mA or 0-10 V output can be wired to an analog input on an Embedos Edge device.

The Edge device is an IP20 unit, so it goes in a panel or control room away from the hot and dusty zone, with the sensor cable run back to it.

Download the Free “Ultrasonic vs Inductive vs Photoelectric Checklist”

Enter your email and the form emails you the copy link to the Google Sheet.


Can ultrasonic sensors see glass or clear film?

Yes. Transparency and colour do not affect an ultrasonic echo, which is why ultrasonic often replaces photoelectric for clear targets.

Next step! Send us a Mail

Send us the stroke, the resolution and speed you need, how the sensor will be mounted (in a cylinder, on a profile or with a wire), the conditions at the sensor head and the input your PLC accepts.

Email: team@embedos.io

Help Us Help You Leverage The Power Of Industrial Automation & Industrial IoT - IIoT.
Data Center Noise Monitoring: Measure Against Indian Limits

Use a third-party sound level meter that meets IEC 61672-1 (Class 1 for compliance and disputes, Class 2 for screening), measure A-weighted Leq over day (6:00 a.m. to 10:00 p.m.) and night (10:00 p.m. to 6:00 a.m.)

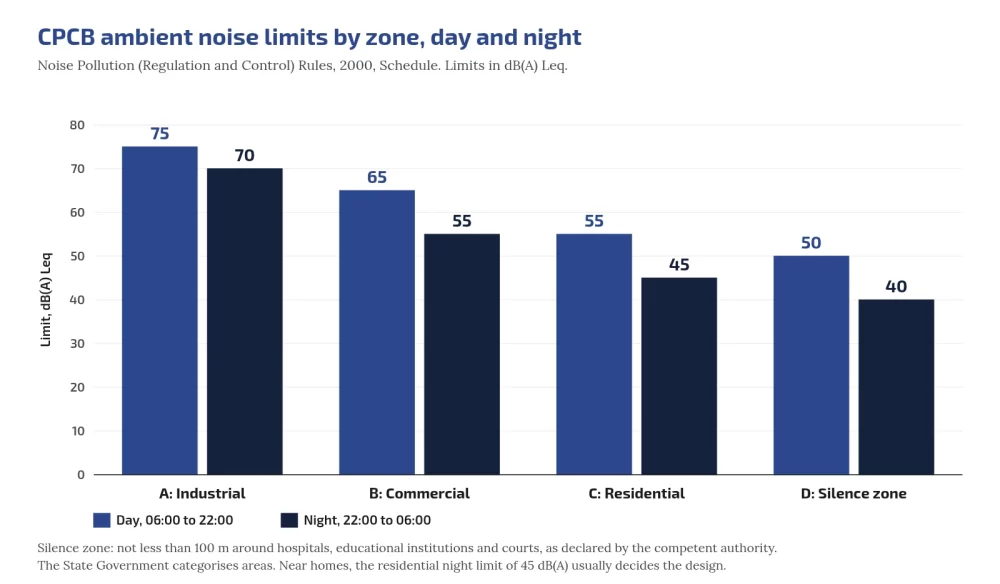
This is defined in India’s Noise Pollution (Regulation and Control) Rules, 2000, and compare with zone limits: industrial 75/70, commercial 65/55, residential 55/45, silence 50/40 dB(A) Leq (CPCB C1).

Add L90 for background, C-weighted levels and 1/3-octave spectra for low-frequency tones, and continuous logging with day/night alarms so you see problems before neighbours report them.

Who this is for: EHS managers, facility engineers and consultants responsible for noise compliance and community relations at data centers and plants with DG sets.

Hub: data center noise overview.

Tell us what you need on site

Need this on your site? Tell us your requirement

Embedos blogs embedos-blogs: CPCB ambient day and night limits by zone

Class 1 or Class 2 (the meter, not Embedos)

IEC 61672-1 sets performance classes for sound level meters; Class 1 has tighter tolerances than Class 2 (IEC webstore). Both cover A/C/Z weightings, Fast/Slow time weightings and integrating (Leq) functions; periodic tests are in IEC 61672-3.

If a result may face a regulator, court or resident consultant, use Class 1 with calibration certificate and field calibrator checks before and after. Permanent screening points may use Class 2 if you state that in reports.

Never label Embedos Edge as Class 1; the class belongs to the third-party meter. Embedos does the intelligence, the continuous logging!

Descriptors: Leq, L90, spectra

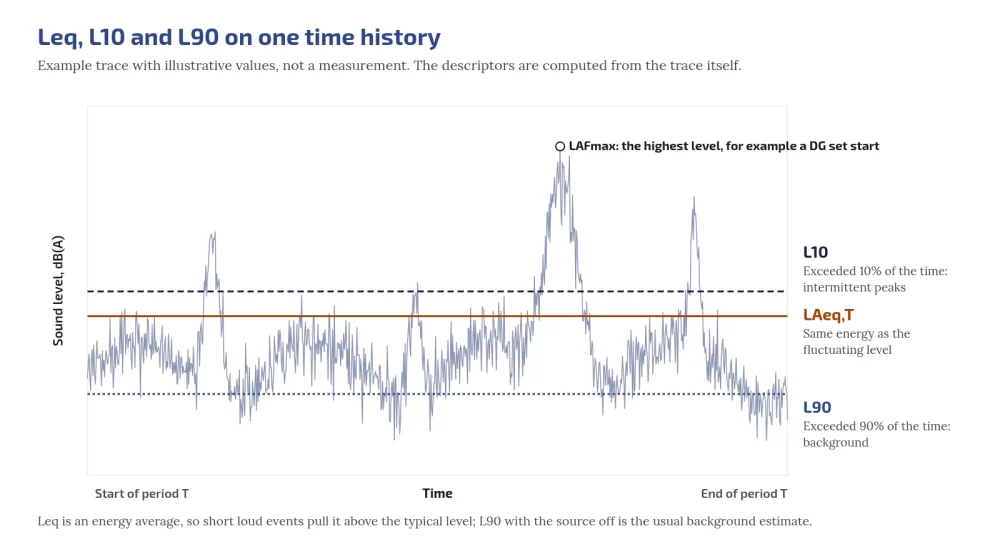
  • LAeq,T: A-weighted equivalent continuous level (NTi LAeq explainer).
  • L90: level exceeded 90% of the time (background floor) (NTi percentiles).
  • L10 / LAFmax: intermittent peaks and Fast maxima.
  • 1/3-octave or FFT: transformer tones at 100 Hz multiples; engine firing; fan BPF (hum; fans).

Embedos blogs embedos-blogs: Leq L10 L90 time history

Worked example: combining hourly Log

L_eq,total = 10 log10( (1/N) Σ 10^(L_i/10) ) (ISO 1996-1 definition). Eight night hours 44, 44, 45, 43, 43, 52, 44, 44 dB → about 46.2 dB. One loud genset hour can push a residential night over 45 dB(A).

Background correction 

Source+background 52 dB, background alone 46 dB → source ≈ 50.7 dB. When the difference is under about 3 dB, correction is unreliable (ISO 1996-2 residual sound).

Tonal penalties and the C−A screen

ISO 1996-2 Annex C can add 0 to 6 dB for tonal audibility (Pedersen, Acoustics 2008).

India’s 2000 Rules do not specify a tonal penalty; using one internally still predicts complaints. WHO 1999 §4.3 is widely cited for recommending frequency analysis when dB(C)−dB(A) > 10 dB (IRIS handle)

CPCB ambient limits

Zone Day Night
Industrial 75 70
Commercial 65 55
Residential 55 45
Silence 50 40

Sources: Central Pollution Control Board (CPCB); THE NOISE POLLUTION (REGULATION AND CONTROL) RULES, 2000; Day 6:00 a.m.-10:00 p.m.; night 10:00 p.m.-6:00 a.m.

Silence zone ≥100 m around hospitals, educational institutions and courts;

Night is 5 dB lower than day in industrial zones and 10 dB lower in commercial, residential and silence zones (never “10-15”).

Rule 7(1): complaint if noise exceeds the ambient standard by 10 dB(A) or more, or night restriction violated.

Which limit matters most for a DC next to homes?

Usually the nearest residential night limit: 45 dB(A) Leq.

DG set limits

From CPCB Limits; Diesel Genset Noise Limits; Noise Limits for Generators:

  • New DG ≤1000 kVA manufactured on/after 1 Jan 2005: 75 dB(A) at 1 m from enclosure surface; integral acoustic enclosure.
  • Other sets: enclosure/room ≥25 dB(A) IL or ambient, whichever higher (0.5 m points averaged); muffler ≥25 dB(A) IL.

Do not cite GSR 436(E) for these dB values (supply/transition only).

World Health Organization (WHO) context

  • NNG 2009: target 40 dB Lnight,outside; interim 55 dB.
  • ENG 2018 / compendium W4: road <53 Lden / <45 Lnight; rail <54 / <44; aircraft <45 / <40; wind <45 Lden. ENG 2018 made no industrial noise guideline.

Use WHO as health reference; CPCB for compliance. Neighbours framing: health effects post.

Measurement checklist

  • Meter class stated (Class 1 for compliance); calibration current
  • Field calibrator before and after, recorded
  • Microphone 1.2 to 1.5 m above ground; windscreen; weather noted
  • Day and night periods per CPCB times
  • LAeq, LCeq, L90, L10, LAFmax
  • 1/3-octave spectra
  • Source on/off where possible
  • Operating state: IT load, cooling stages, transformer load, DG status
  • Zone category confirmed with competent authority
  • Tonal assessment method stated

Continuous logging architecture

Embedos Edge is our platform.

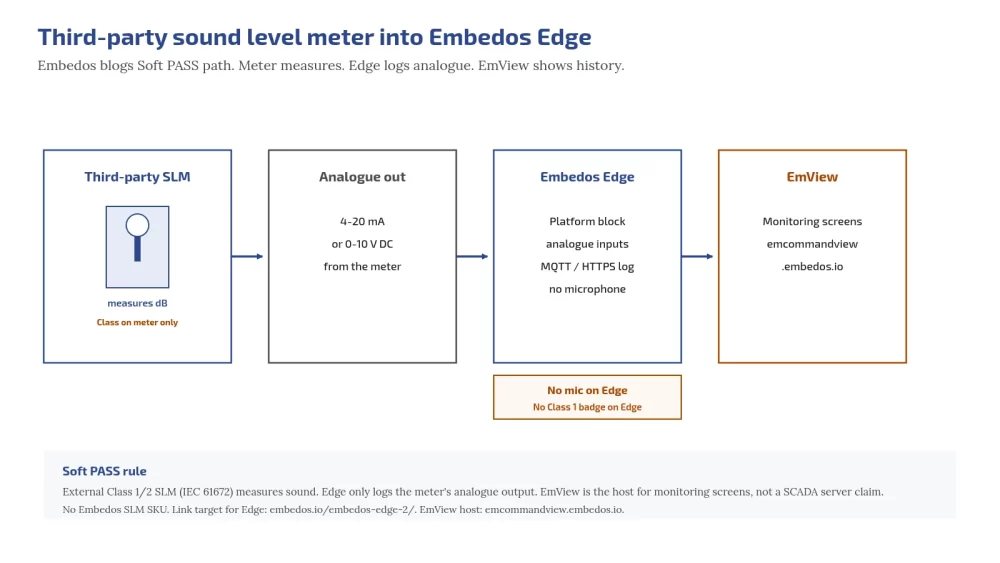
Edge can log readings from a third-party sound level meter, noise meter or recorder via 4-20 mA or 0-10 V analogue inputs.

Edge has no built-in microphone and does not do dosimetry; the meter measures. EmView monitoring/dashboard/SCADA (EmView=B) can show those logged readings at https://emcommandview.embedos.io/; report exports.

Class 1/2 under IEC 61672 refers only to the third-party meter. Scaling: https://tools.embedos.io/4-20ma-loop-scaling-calculator/.

Embedos blogs embedos-blogs: third-party SLM analogue into Edge then EmView

Practical rules (set with your consultant):

  1. Outdoor monitoring-grade third-party meters at boundary and receiver-facing positions with analogue outputs.
  2. Edge logs those readings; compute period Leq, L90, C−A and selected bands in your analytics layer as agreed.
  3. Correlate with DG run and fan/chiller stage from existing plant systems.
  4. Separate day/night thresholds; projected night Leq warning; tonal/low-frequency flags.
Does Edge measure dB by itself?

No. A third-party meter measures; Edge logs its analogue output. Edge can add a microphone. 

Next step. Drop a Mail!

Send your zone category, proposed meter positions and whether you need Class 1 compliance logging or operations screening, and we will help you with Edge.

Email: team@embedos.io

Help Us Help You Leverage The Power Of Industrial Automation & Industrial IoT – IIoT.

Data Center Noise Levels Inside: Protect Staff Hearing

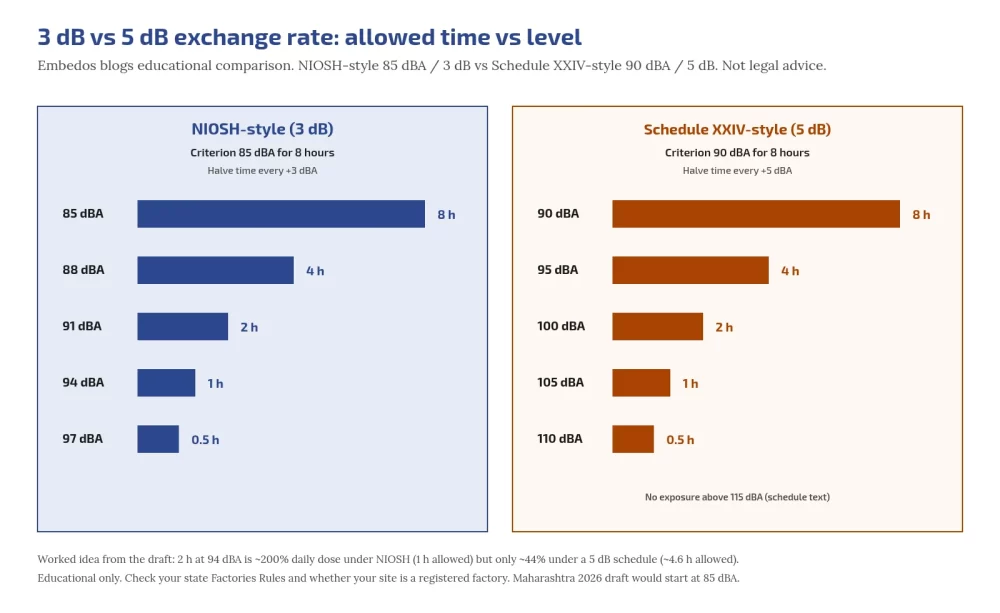
Data center noise levels inside the white space commonly sit in the mid 80s to mid 90s dBA, close to where long shifts start to damage hearing. In Maharashtra, Schedule XXIV of the Maharashtra Factories Rules, 1963 sets 90 dBA for 8 hours with a 5 dB exchange rate; NIOSH recommends 85 dBA for 8 hours with a 3 dB exchange rate, which is stricter.

Measure the hall, measure the people, cut noise at source first, and issue hearing protection that is fitted and worn. Engineering guidance, not legal advice: whether Factories Act schedules cover your site depends on registration and state rules.

Who this is for: facility, EHS and operations engineers running data halls, and contractors who spend long shifts in them. Neighbours outside: health effects.

Tell us what you need on site

Need this on your site? Tell us your requirement

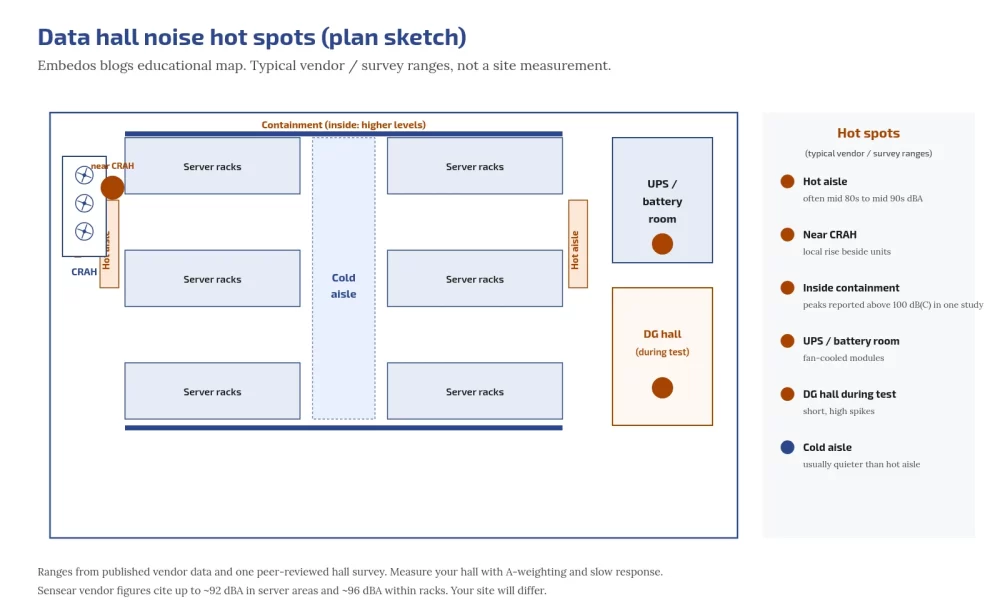
Embedos blogs embedos-blogs: data hall noise hotspots map

How loud inside, and where

Most indoor noise is fan noise: server fans plus CRAH/CRAC overview .

Published surveys are scarce. Vendor infographics (for example Sensear) put server areas up to about 92 dBA and within racks higher; treat as vendor data. A peer-reviewed field study of a large air-cooled hall (ISO 9612) found average exposure often above 85 dBA, with C-weighted peaks above 100 dB inside cold-aisle containment (Cho et al., Journal of the Architectural Institute of Korea, 2026, )

Hot spots: hot aisle behind dense racks, next to CRAH, inside containment, UPS/battery rooms, DG hall during tests. Compare declared IT noise via free ECMA-74 / ECMA-109.

How many decibels is a data center inside?

Vendor data and one peer-reviewed hall survey put many areas at or above 85 dBA. Your hall differs with density and containment; measure it.

Indian schedules vs NIOSH and OSHA

Factories Act 1948 has no noise table; states set Schedule XXIV. Maharashtra Factories Rules, 1963 Schedule XXIV (as on 1 Sep 2025 PDF): 90 dBA for 8 h, 5 dB exchange, no exposure above 115 dBA, impulse 140 dB peak (Maharashtra PDF ) 

Engineering/admin controls first; protectors; audiometry within 14 days of employment then at least yearly where the schedule applies.

NIOSH REL: 85 dBA 8-h TWA, 3 dB exchange. OSHA 29 CFR 1910.95 uses 90 dBA / 5 dB with 85 dBA action level (US reference only). Many operators adopt NIOSH internally even if Factories schedules apply differently. Maharashtra 2026 draft OSH rules proposing 85 dBA were draft when last checked; verify status before planning to them.

Embedos blogs embedos-blogs: 3 dB vs 5 dB exchange rate

Why exchange rate changes the answer

3 dB is about equal energy (doubling). 5 dB allows more time at high levels. Illustrative: 2 h at 94 dBA is about 200% NIOSH daily dose (allowed 1 h) but under about 44% on a 5 dB schedule reading.

An 8 hr shift at 88 dBA is 200% NIOSH dose; Schedule XXIV text that ignores below 90 dBA can read as zero dose on a strict reading. Write your internal rule down.

Which occupational limit does NIOSH recommend?

85 dBA as an 8-hour TWA with a 3 dB exchange rate.

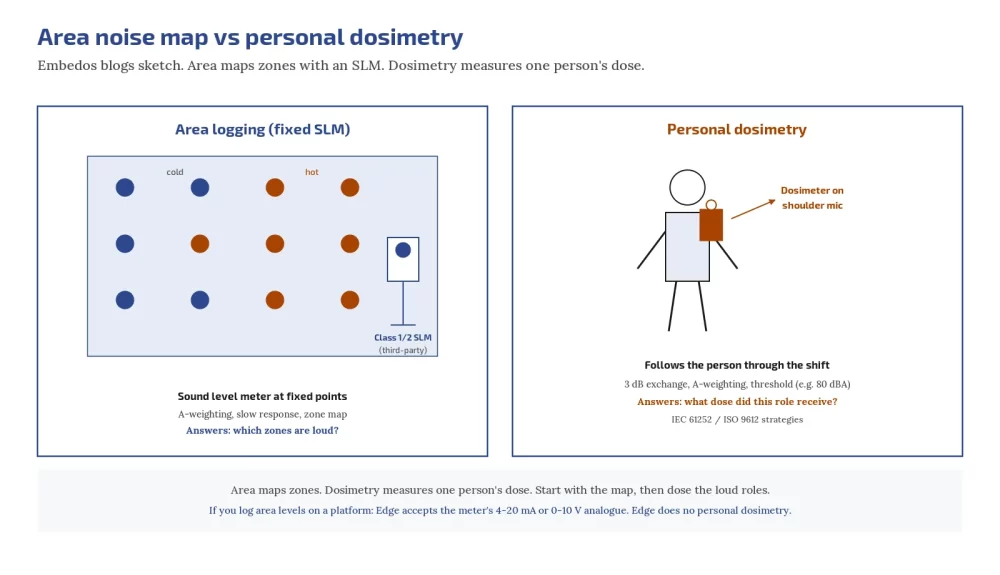
Area monitoring vs personal dosimetry

Embedos blogs embedos-blogs: area SLM vs personal dosimeter

NIOSH: sound level meter maps an area; dosimeter measures one person. Map with A-weighting, slow response, equipment running. Type 1/2 meter; IEC 61672-1 for instruments (IEC).

Dosimetry strategies: ISO 9612 (paid); personal meters IEC 61252 (paid). Class labels apply to the third-party instruments, not to Edge.

Speech, alarms and controls order

If you raise your voice at arm’s length, noise is likely hazardous (NIOSH rule of thumb). Use hand signals/radio read-backs and visual beacons in loud zones.

Order: quieter equipment (ECMA-109), slower fans (fan acoustics), separate people from sources (passive),

limit time, then protectors. NIOSH: consumer ANC headphones are not hearing protection unless labelled with an NRR (NIOSH PPE)

See ANC post.

Hearing conservation checklist

  1. Write internal limit (Schedule / NIOSH / both).
  2. Map hall; mark zones above limit; post signs.
  3. Dosimetry on high-exposure roles.
  4. Fix sources first.
  5. Issue rated protectors; fit test; train.
  6. Baseline and periodic audiometry per applicable schedule / NIOSH advice.
  7. Re-measure after rack/cooling changes; keep records.

Area logging with Edge, not dosimetry

Embedos Edge is our platform. Edge can log readings from a third-party sound level meter, noise meter or recorder via 4-20 mA or 0-10 V analogue inputs.

Edge has no built-in microphone and does not do dosimetry; the meter measures. EmView monitoring/dashboard/SCADA can show those logged readings at https://emcommandview.embedos.io/; report exports HOLD. Class 1/2 under IEC 61672 refers only to the third-party meter.

Scaling: https://tools.embedos.io/4-20ma-loop-scaling-calculator/.

Edge monitors area levels from a wired third-party meter; it does not replace personal dosimeters.

Do you need hearing protection in a data center?

Where maps or dosimetry show exposure above your limit, yes, until controls bring it down.

Next step

Send your hall layout, any existing noise map and which limit you use internally, and we will help you plan fixed area meter logging (not personal dosimetry).

Email: team@embedos.io

Help Us Help You Leverage The Power Of Industrial Automation & Industrial IoT – IIoT.